Digital Marketing Campaign Analytics

Group Project Final Report Presentation

Yushan Huang
Sora Hosoda
Grace Sen
Sandy Zhu
Jungmin Woo

2026-08-12

Table of Contents

  1. Introduction
  2. Population / Sample & Sample Characteristics
  3. Analytics Objective 1 — Yushan Huang - Marketing Channels and Campaign Types
  4. Analytics Objective 2 — Jungmin Woo - Campaign Performance
  5. Analytics Objective 3 — Grace Sen - Customer Demographics and Conversion
  6. Analytics Objective 4 — Sandy Zhu - Customer Interaction and Purchase Behavior
  7. Analytics Objective 5 — Sora Hosoda - Predictive Analytics
  8. Conclusion
  9. Appendix

Introduction

Problem Definition

Digital marketing teams use multiple campaign channels and campaign strategies to reach customers, but it is not always clear which approaches are most strongly associated with customer conversion. Without data-driven evidence, marketing resources may be allocated to channels or campaign types that do not meaningfully improve conversion outcomes.

  • Context: The dataset represents multi-channel digital marketing campaigns, including Social Media, Email, PPC, Referral, and SEO.
  • Business gap: Marketers need clearer evidence about which campaign characteristics and customer behaviors are associated with successful conversion.
  • Decision need: Identify actionable patterns that can support better campaign design, targeting, engagement, and resource allocation.

Research Objectives

  • RO1: To analyze how different marketing channels and campaign types affect customer conversion. — linked to AO1
  • RO2: Impact of Campaign Channel and Type on Customer Conversion
  • RO3: To examine whether customer demographic characteristics influence the likelihood of digital marketing conversion.
  • RO4: To evaluate how customer interaction and previous purchasing behavior relate to short-term marketing response and customer conversion, and to identify the most important behavioral drivers of conversion.
  • RO5: To develop a predictive model that identifies the most useful factors for predicting customer conversion using customer demographics, campaign information, engagement variables, and purchase history.

Importance of the Research

  • Improve marketing effectiveness: Understanding the factors associated with conversion can help marketers make more informed decisions about campaign strategy and customer targeting.
  • Support resource allocation: Comparing marketing channels and campaign types can reveal whether conversion outcomes differ meaningfully across marketing approaches.
  • Generate customer insights: Examining engagement, purchasing behavior, and loyalty-related measures can help explain how customers respond throughout the digital marketing journey.
  • Apply predictive analytics: Classification and ensemble methods provide a systematic way to evaluate conversion patterns and assess how useful marketing and behavioral variables are for prediction.
  • Business stakeholders: The findings can support marketing managers, campaign planners, and customer analytics teams when designing and evaluating future campaigns.

Population / Sample

Population / Sample

Code
library(tidyverse)
library(tidymodels)
library(vip)         # variable importance
library(DALEX)        # PDP / SHAP-style explanations
library(DALEXtra)
library(patchwork)

tidymodels_prefer()
theme_set(theme_minimal(base_size = 14))

raw_data <- read_csv("digital_marketing_campaign_dataset.csv", show_col_types = FALSE)

glimpse(raw_data)
Rows: 8,000
Columns: 20
$ CustomerID          <dbl> 8000, 8001, 8002, 8003, 8004, 8005, 8006, 8007, 80…
$ Age                 <dbl> 56, 69, 46, 32, 60, 25, 38, 56, 36, 40, 28, 28, 41…
$ Gender              <chr> "Female", "Male", "Female", "Female", "Female", "F…
$ Income              <dbl> 136912, 41760, 88456, 44085, 83964, 42925, 25615, …
$ CampaignChannel     <chr> "Social Media", "Email", "PPC", "PPC", "PPC", "Soc…
$ CampaignType        <chr> "Awareness", "Retention", "Awareness", "Conversion…
$ AdSpend             <dbl> 6497.8701, 3898.6686, 1546.4296, 539.5259, 1678.04…
$ ClickThroughRate    <dbl> 0.04391851, 0.15572507, 0.27749037, 0.13761125, 0.…
$ ConversionRate      <dbl> 0.08803141, 0.18272468, 0.07642272, 0.08800419, 0.…
$ WebsiteVisits       <dbl> 0, 42, 2, 47, 0, 6, 42, 48, 13, 22, 47, 16, 13, 8,…
$ PagesPerVisit       <dbl> 2.399017, 2.917138, 8.223619, 4.540939, 2.046847, …
$ TimeOnSite          <dbl> 7.396803, 5.352549, 13.794901, 14.688363, 13.99337…
$ SocialShares        <dbl> 19, 5, 0, 89, 6, 95, 54, 96, 73, 14, 94, 23, 28, 8…
$ EmailOpens          <dbl> 6, 2, 11, 2, 6, 5, 14, 9, 4, 8, 16, 18, 16, 8, 16,…
$ EmailClicks         <dbl> 9, 7, 2, 2, 6, 8, 3, 3, 8, 4, 5, 6, 5, 1, 8, 1, 8,…
$ PreviousPurchases   <dbl> 4, 2, 8, 0, 8, 0, 6, 0, 5, 8, 6, 5, 4, 2, 1, 1, 8,…
$ LoyaltyPoints       <dbl> 688, 3459, 2337, 2463, 4345, 3316, 930, 2983, 460,…
$ AdvertisingPlatform <chr> "IsConfid", "IsConfid", "IsConfid", "IsConfid", "I…
$ AdvertisingTool     <chr> "ToolConfid", "ToolConfid", "ToolConfid", "ToolCon…
$ Conversion          <dbl> 1, 1, 1, 1, 1, 1, 1, 1, 1, 1, 1, 1, 1, 1, 1, 0, 1,…
  • Population: Customers exposed to the company’s digital marketing campaigns
  • Sample: 8,000 customers, 20 variables
  • Sampling frame / period: The dataset does not provide a specific campaign period or geographic region.

Data Cleaning

Data summary
Name campaign_data
Number of rows 8000
Number of columns 17
_______________________
Column type frequency:
factor 4
numeric 13
________________________
Group variables None

Variable type: factor

skim_variable n_missing complete_rate ordered n_unique top_counts
Gender 0 1 FALSE 2 Fem: 4839, Mal: 3161
CampaignChannel 0 1 FALSE 5 Ref: 1719, PPC: 1655, Ema: 1557, SEO: 1550
CampaignType 0 1 FALSE 4 Con: 2077, Awa: 1988, Con: 1988, Ret: 1947
Conversion 0 1 FALSE 2 Yes: 7012, No: 988

Variable type: numeric

skim_variable n_missing complete_rate mean sd p0 p25 p50 p75 p100 hist
Age 0 1 43.63 14.90 18.00 31.00 43.00 56.00 69.00 ▇▇▇▇▇
Income 0 1 84664.20 37580.39 20014.00 51744.50 84926.50 116815.75 149986.00 ▇▇▇▇▇
AdSpend 0 1 5000.94 2838.04 100.05 2523.22 5013.44 7407.99 9997.91 ▇▇▇▇▇
ClickThroughRate 0 1 0.15 0.08 0.01 0.08 0.15 0.23 0.30 ▇▇▇▇▇
ConversionRate 0 1 0.10 0.05 0.01 0.06 0.10 0.15 0.20 ▇▇▇▇▇
WebsiteVisits 0 1 24.75 14.31 0.00 13.00 25.00 37.00 49.00 ▇▇▇▇▇
PagesPerVisit 0 1 5.55 2.61 1.00 3.30 5.53 7.84 10.00 ▇▇▇▇▇
TimeOnSite 0 1 7.73 4.23 0.50 4.07 7.68 11.48 15.00 ▇▇▇▇▇
SocialShares 0 1 49.80 28.90 0.00 25.00 50.00 75.00 99.00 ▇▇▇▇▇
EmailOpens 0 1 9.48 5.71 0.00 5.00 9.00 14.00 19.00 ▇▇▇▇▇
EmailClicks 0 1 4.47 2.86 0.00 2.00 4.00 7.00 9.00 ▇▇▇▇▇
PreviousPurchases 0 1 4.49 2.89 0.00 2.00 4.00 7.00 9.00 ▇▇▇▇▇
LoyaltyPoints 0 1 2490.27 1429.53 0.00 1254.75 2497.00 3702.25 4999.00 ▇▇▇▇▇

Sample Characteristics

Sample Characteristics (cont.)

  • Overall conversion rate: 88% (class-imbalanced — relevant for classification AOs)
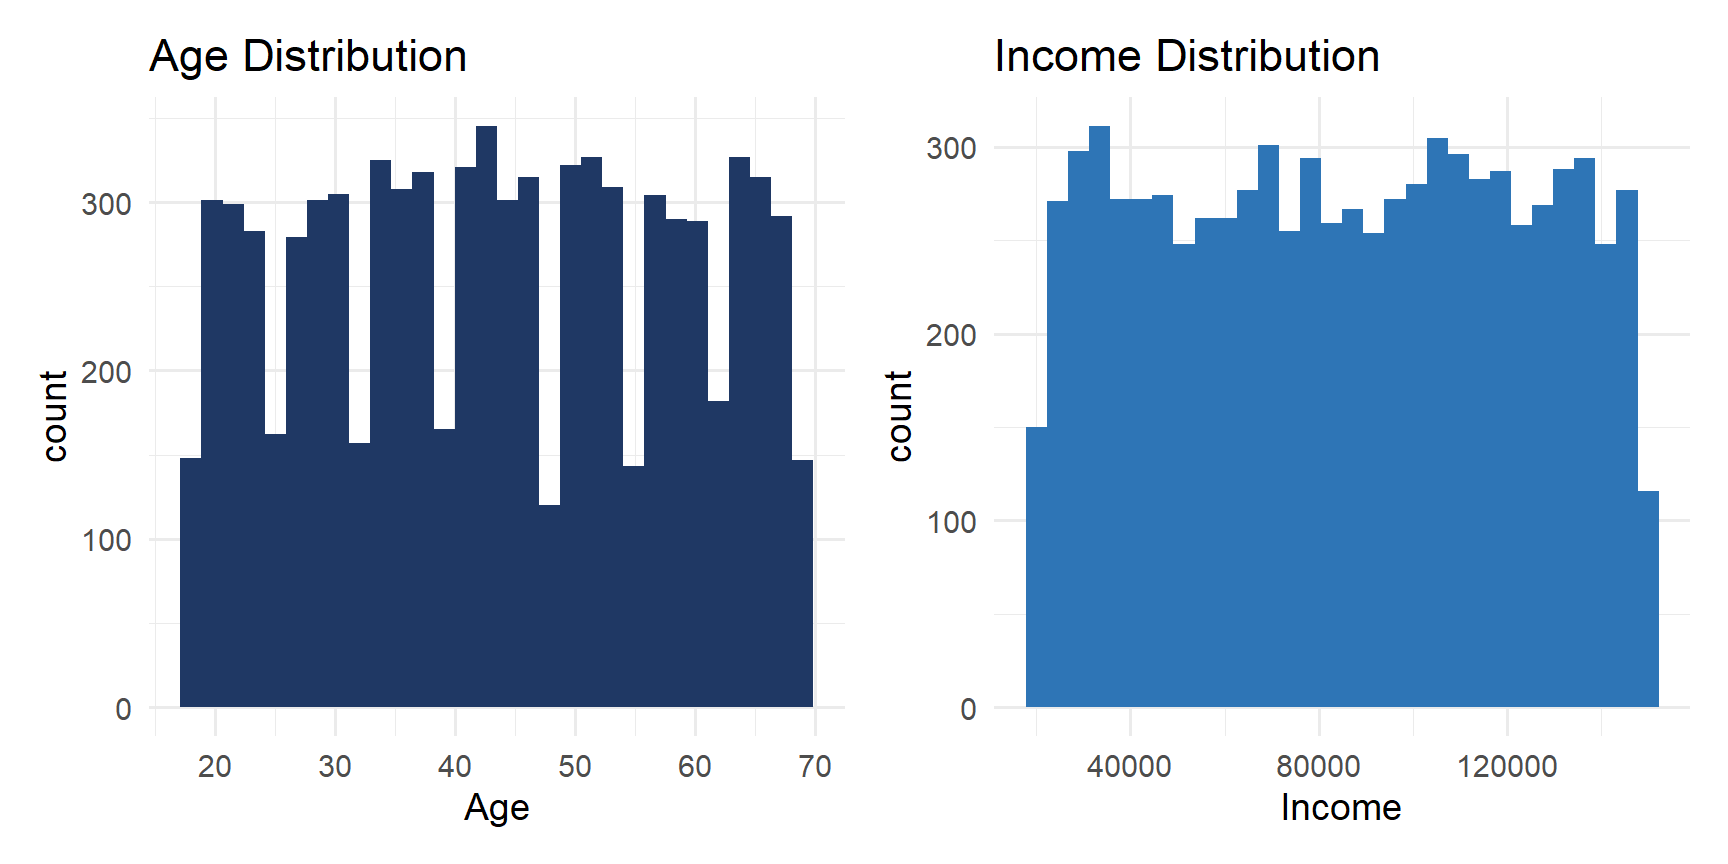
  • The sample includes customers across a wide range of ages and income levels.
  • Customers were exposed to five digital marketing channels: Social Media, Email, PPC, Referral, and SEO.
  • The overall conversion rate is approximately 87.7%, indicating a strong class imbalance that should be considered when evaluating classification models.

Analytics Objective 1 — Yushan Huang

AO1: Marketing Channels and Campaign Types

RO1: To analyze how different marketing channels and campaign types affect customer conversion.

  • Target variable: Conversion (No / Yes)
  • Independent variables: CampaignChannel, CampaignType
  • Problem type: Binary classification
  • Business question: Which marketing channels and campaign types are associated with higher customer conversion?
  • Analytical focus: Compare group-level conversion patterns and test whether channel/type alone can predict individual conversion.

AO1: Machine Learning Methods to be Used

  • Not used because Conversion is a binary outcome.
  • Logistic regression is used as a classification model and provides interpretable odds ratios.
  • Logistic Regression — interpretable baseline for estimating the direction and magnitude of associations
  • Decision Tree — captures possible non-linear splits and interactions
  • Random Forest — compares an ensemble classifier with simpler models and provides variable importance

AO1: Data Wrangling & Visualization

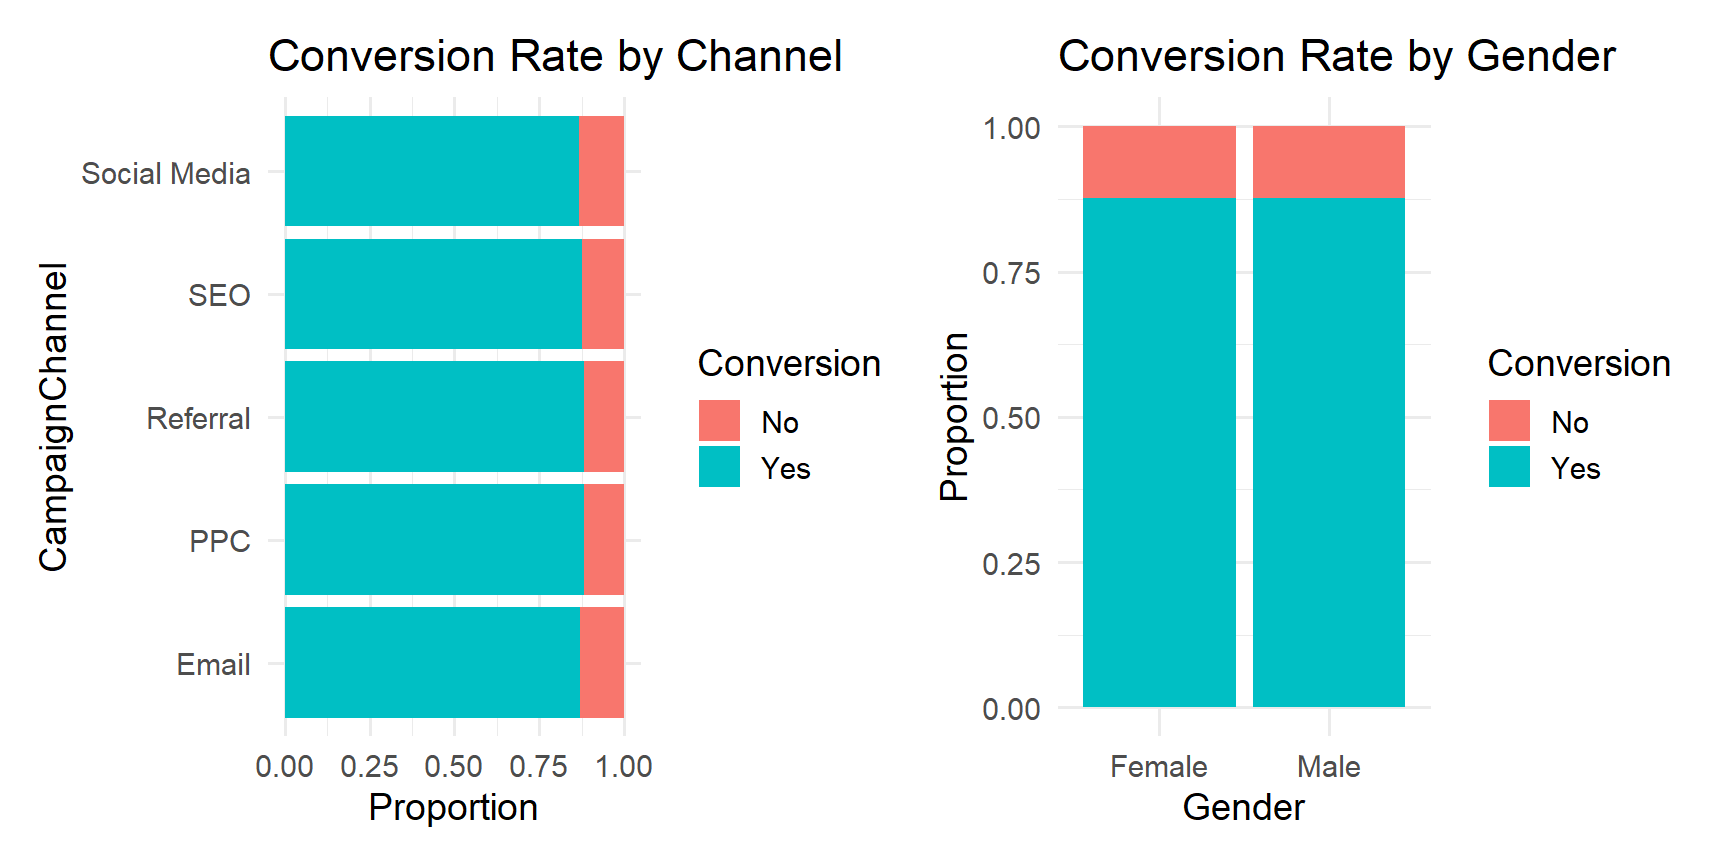
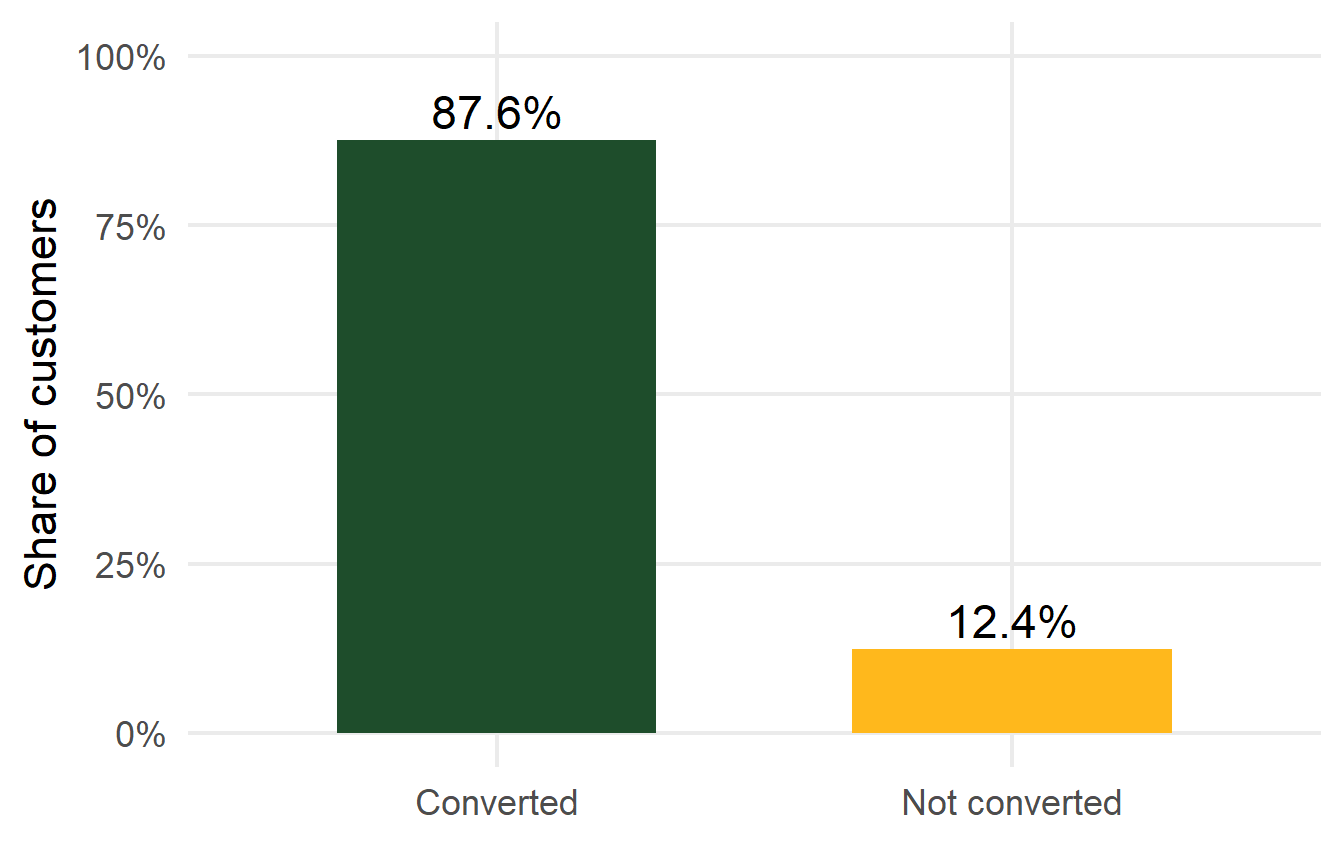
  • Overall conversion rate: 87.6%
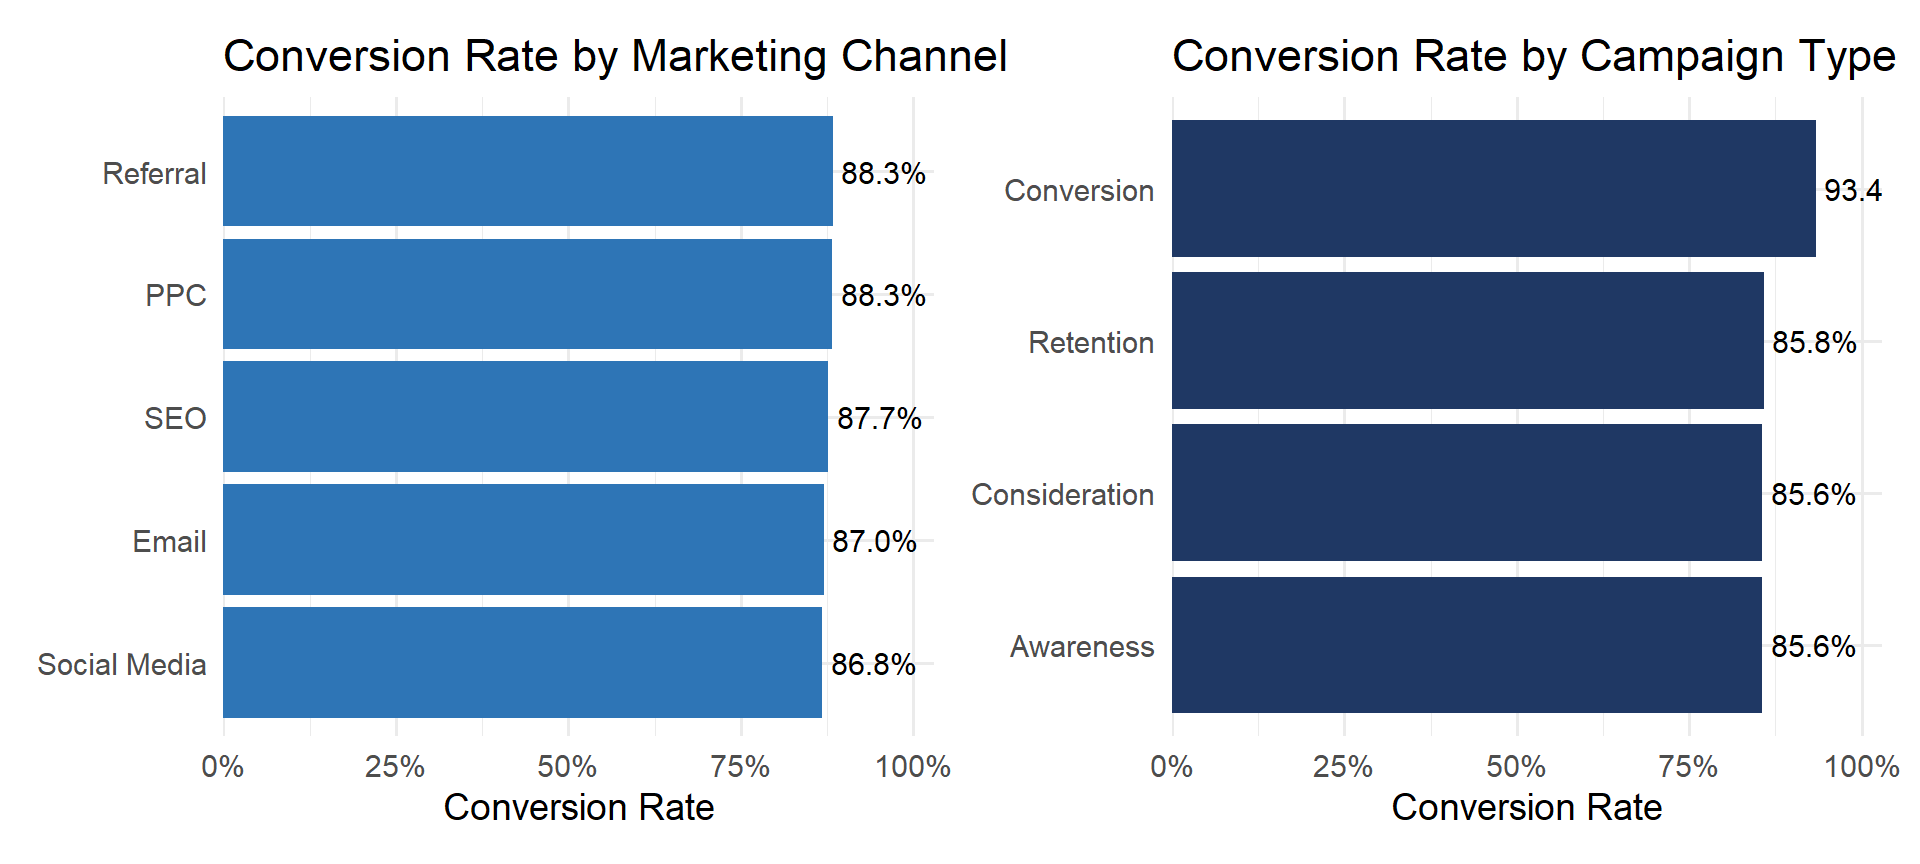
  • Channel conversion rates are tightly clustered (about 86.8%–88.3%), suggesting only small raw differences across channels.
  • Conversion campaigns have the highest conversion rate (93.4%), compared with roughly 85.6%–85.8% for the other campaign types.

AO1: Channel × Campaign Type Pattern

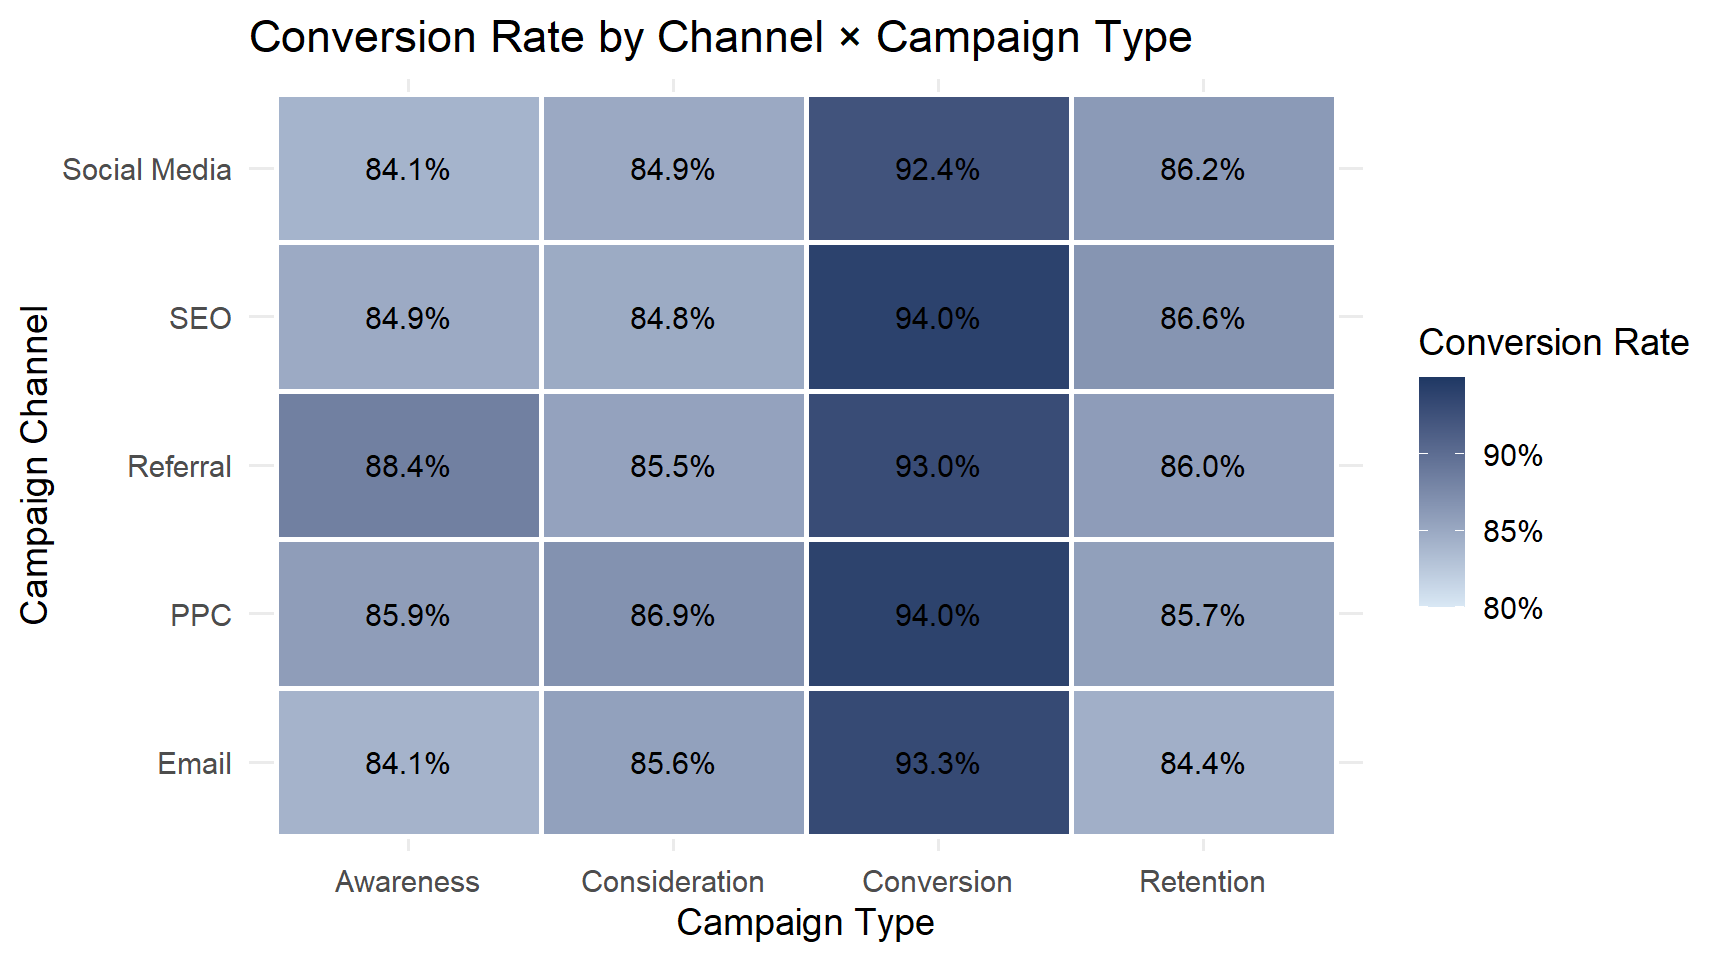
  • The strongest combinations are SEO + Conversion (94.0%) and PPC + Conversion (94.0%).
  • The Conversion campaign type is consistently the highest-performing type across all five channels.
  • This pattern suggests that campaign purpose/type is more strongly associated with conversion than channel choice in this sample.

AO1: Model Fitting

  • Split: 80% training / 20% testing, stratified by Conversion
  • Recipe: dummy encoding + zero-variance removal
  • Models: Logistic Regression, Decision Tree, Random Forest
  • Primary metric: ROC AUC, because the outcome is imbalanced (about 88% conversions)

AO1: Prediction & Model Evaluation

# A tibble: 3 × 5
  model               Accuracy ROC_AUC Sensitivity Specificity
  <chr>                  <dbl>   <dbl>       <dbl>       <dbl>
1 Decision Tree          0.876   0.5             1           0
2 Logistic Regression    0.876   0.554           1           0
3 Random Forest          0.876   0.537           1           0
  • A naive model that predicts “Yes” for everyone already achieves about 87.7% accuracy, so accuracy alone is misleading.
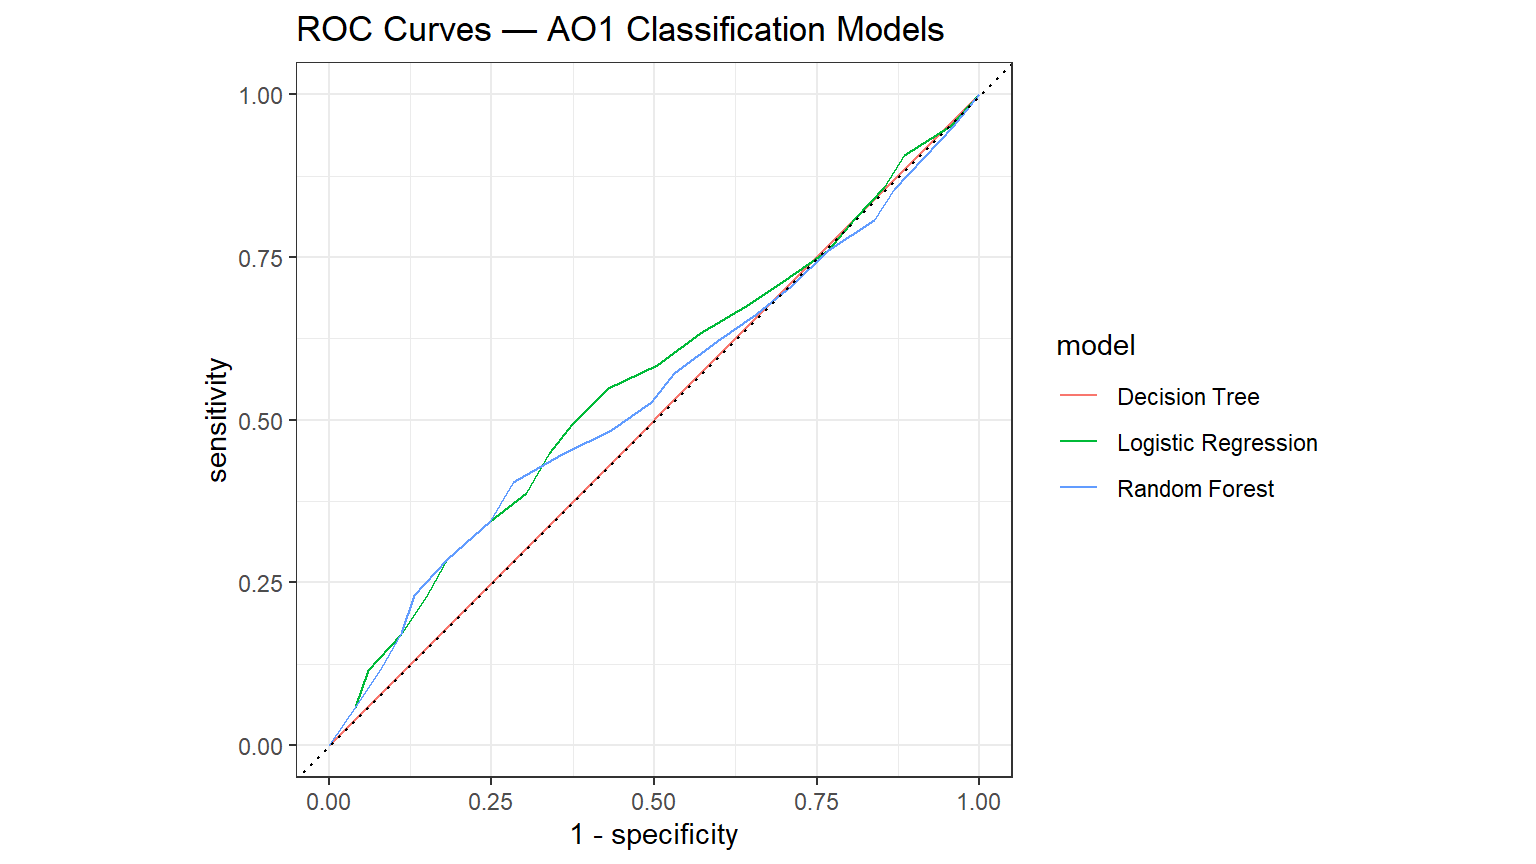
  • The more informative comparison is ROC AUC, which tests whether the models can distinguish converters from non-converters across thresholds.
  • If ROC AUC remains close to 0.50–0.60, CampaignChannel and CampaignType alone have limited individual-level predictive power, even though campaign type shows a clear group-level pattern.

AO1: Interpretation

# A tibble: 7 × 7
  term                  estimate std.error statistic  p.value conf.low conf.high
  <chr>                    <dbl>     <dbl>     <dbl>    <dbl>    <dbl>     <dbl>
1 CampaignType_Convers…    2.49      0.125    7.28   3.31e-13    1.95       3.19
2 CampaignChannel_PPC      1.09      0.122    0.710  4.78e- 1    0.859      1.38
3 CampaignChannel_Refe…    1.05      0.120    0.410  6.82e- 1    0.830      1.33
4 CampaignChannel_Soci…    1.02      0.122    0.147  8.83e- 1    0.801      1.29
5 CampaignChannel_SEO      0.997     0.122   -0.0215 9.83e- 1    0.786      1.27
6 CampaignType_Retenti…    0.972     0.102   -0.276  7.83e- 1    0.797      1.19
7 CampaignType_Conside…    0.958     0.101   -0.426  6.70e- 1    0.786      1.17
NULL
  • Logistic-regression odds ratios show the direction and relative size of differences after accounting for the other predictor.
  • The largest practical contrast is expected for CampaignType = Conversion, consistent with its 93.4% raw conversion rate.
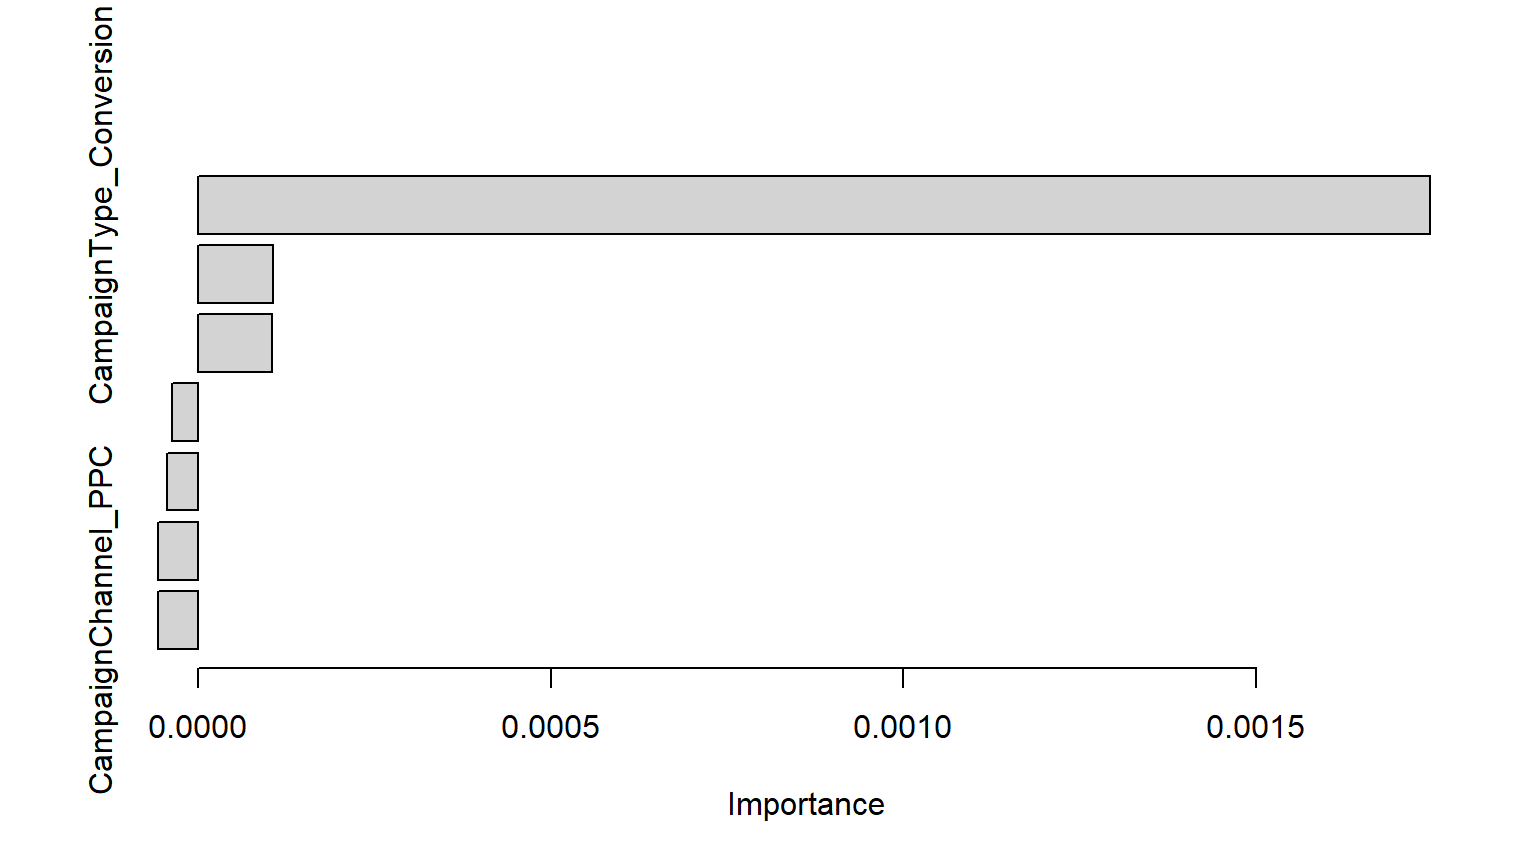
  • Random Forest importance can show whether campaign type or channel contributes more to prediction, but importance should be interpreted cautiously if ROC AUC is weak.

AO1: Summary Findings

  • Campaign type matters more than marketing channel: conversion rates across channels are very similar (86.8%–88.3%), while campaign types show a wider difference.
  • Conversion-focused campaigns perform best: their conversion rate is approximately 93.4%, versus about 85.6%–85.8% for Awareness, Consideration, and Retention campaigns.
  • The pattern is consistent across channels: every channel performs best when the campaign type is Conversion; SEO + Conversion (94.0%) and PPC + Conversion (94.0%) are the strongest observed combinations.
  • Predictive caution: because the overall conversion rate is already 87.7%, high accuracy can be achieved by predicting the majority class. ROC AUC is therefore more useful for judging true discrimination.
  • Business implication: prioritize the design and targeting of conversion-focused campaigns rather than reallocating budget solely on the basis of channel. Channel decisions should also consider cost, reach, and audience fit.

Analytics Objective 2 — Jungmin Woo

AO2: Campaign Performance

RO2: Analyze the impact of marketing channels and campaign types on customer conversion.

  • IV (predictors): CampaignChannel, CampaignType (both categorical)
  • DV (target): Conversion (binary — Yes / No)
  • Problem type: Classification
  • Only these two categorical variables are used as predictors, so this AO isolates the effect of channel and campaign type on conversion, independent of demographic or on-site behavior variables

AO2: Machine Learning Methods to be Used

  • Not applicable (outcome is categorical)
  • Logistic Regression
  • Decision Tree (classification)
  • Random Forest (classification)

AO2: Data Wrangling & Visualization

# A tibble: 1 × 3
  CampaignChannel CampaignType Conversion
            <int>        <int>      <int>
1               0            0          0
# A tibble: 20 × 4
   CampaignChannel CampaignType  ConversionRate     N
   <fct>           <fct>                  <dbl> <int>
 1 SEO             Conversion             0.940   402
 2 PPC             Conversion             0.940   447
 3 Email           Conversion             0.933   416
 4 Referral        Conversion             0.930   445
 5 Social Media    Conversion             0.924   367
 6 Referral        Awareness              0.884   431
 7 PPC             Consideration          0.869   404
 8 SEO             Retention              0.866   389
 9 Social Media    Retention              0.862   370
10 Referral        Retention              0.860   436
11 PPC             Awareness              0.859   412
12 PPC             Retention              0.857   392
13 Email           Consideration          0.856   403
14 Referral        Consideration          0.855   407
15 Social Media    Consideration          0.849   405
16 SEO             Awareness              0.849   390
17 SEO             Consideration          0.848   369
18 Email           Retention              0.844   360
19 Email           Awareness              0.841   378
20 Social Media    Awareness              0.841   377
  • No missing values in CampaignChannel, CampaignType, or Conversion
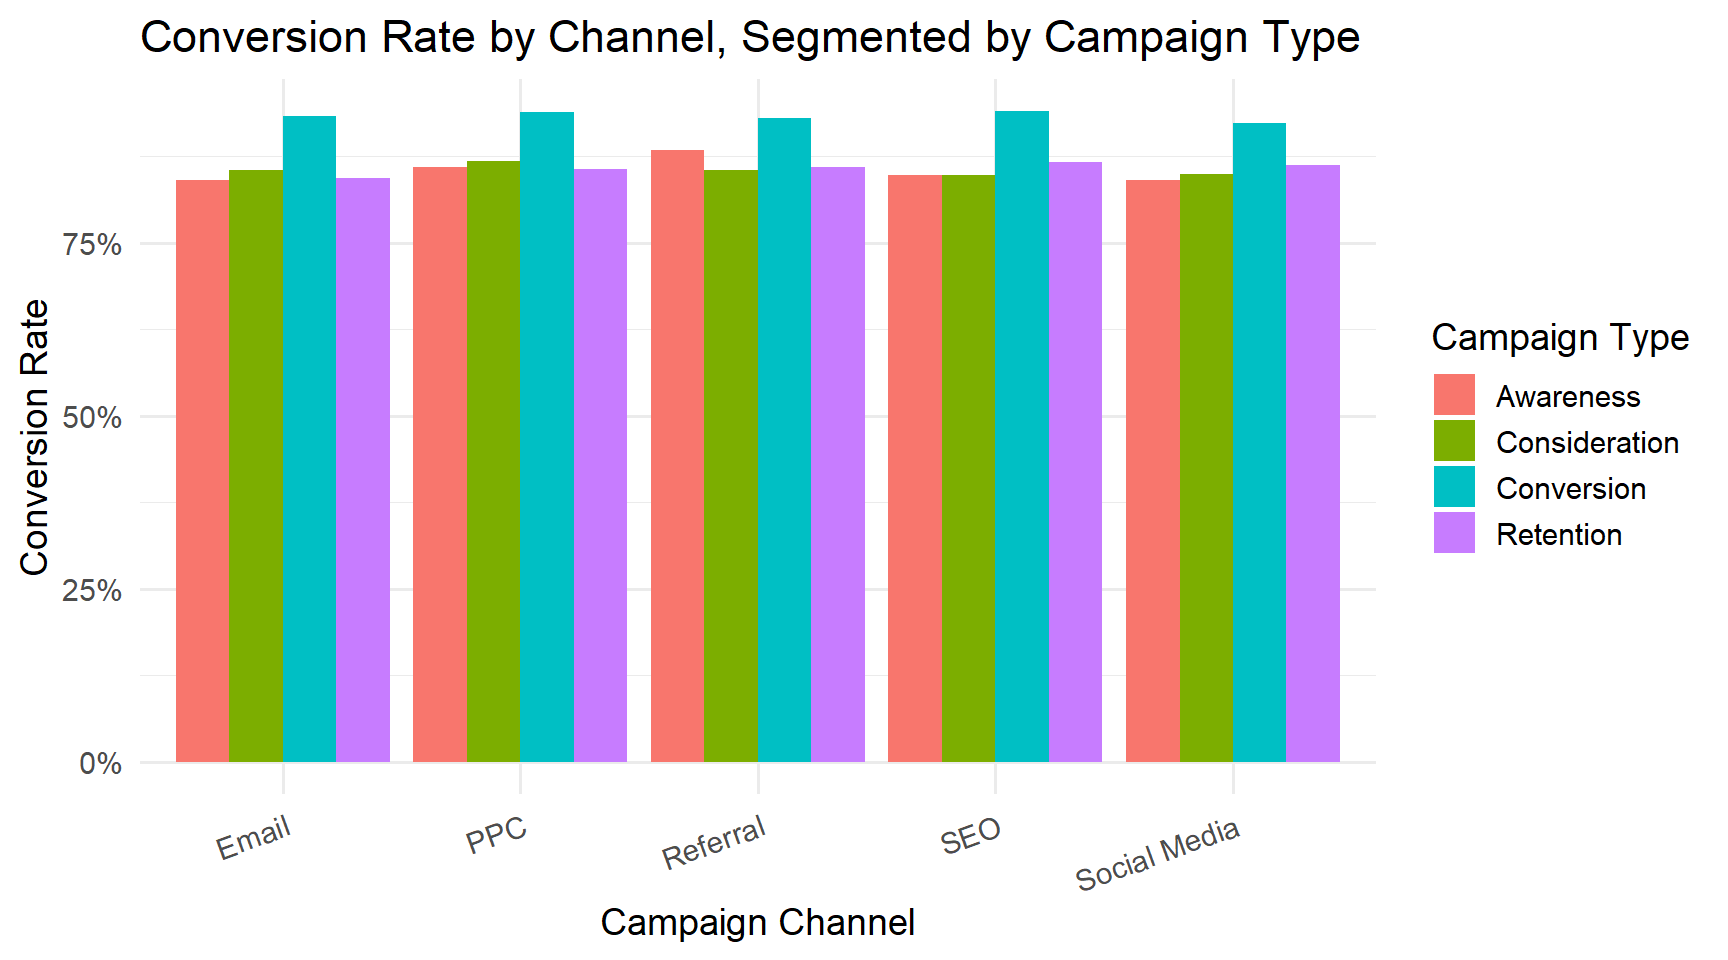
  • The bar chart shows very little spread across channels within each campaign type (bars of the same color are roughly the same height), but a clear gap across campaign types: CampaignType == "Conversion" sits noticeably higher (~92–94%) than Awareness, Consideration, or Retention (~84–88%) in every channel
  • This suggests campaign type may matter more than campaign channel for conversion — tested formally below

AO2: Model Fitting

AO2: Prediction & Model Evaluation

# A tibble: 9 × 4
  model               .metric  .estimator .estimate
  <chr>               <chr>    <chr>          <dbl>
1 Decision Tree       accuracy binary         0.876
2 Logistic Regression accuracy binary         0.876
3 Random Forest       accuracy binary         0.876
4 Decision Tree       f_meas   binary         0.934
5 Logistic Regression f_meas   binary         0.934
6 Random Forest       f_meas   binary         0.934
7 Decision Tree       roc_auc  binary         0.5  
8 Logistic Regression roc_auc  binary         0.554
9 Random Forest       roc_auc  binary         0.543
  • All three models land at essentially the same accuracy (~87.6%), which matches the overall base rate of Conversion == "Yes" in the data — the models are not beating a “always predict Yes” baseline on accuracy alone
  • ROC AUC is low (~0.53–0.54, just above the 0.50 random-guess line), meaning CampaignChannel and CampaignType alone have only weak discriminative power for individual-level conversion, even though the group-level rates in the bar chart differ by type
  • This is a common pattern: a variable can show a real, statistically significant group-level effect while still being a weak individual-level predictor, because most of the variation in who converts is driven by other factors (behavioral, demographic) not included in this AO by design

AO2: Interpretation


    Pearson's Chi-squared test

data:  table(campaign_data$CampaignChannel, campaign_data$Conversion)
X-squared = 2.7849, df = 4, p-value = 0.5944

    Pearson's Chi-squared test

data:  table(campaign_data$CampaignType, campaign_data$Conversion)
X-squared = 84.454, df = 3, p-value < 2.2e-16
# A tibble: 8 × 5
  term                         estimate std.error statistic  p.value
  <chr>                           <dbl>     <dbl>     <dbl>    <dbl>
1 (Intercept)                   1.77        0.106   16.7    6.21e-63
2 CampaignType_Conversion       0.911       0.125    7.28   3.31e-13
3 CampaignChannel_PPC           0.0864      0.122    0.710  4.78e- 1
4 CampaignType_Consideration   -0.0429      0.101   -0.426  6.70e- 1
5 CampaignChannel_Referral      0.0492      0.120    0.410  6.82e- 1
6 CampaignType_Retention       -0.0280      0.102   -0.276  7.83e- 1
7 CampaignChannel_Social.Media  0.0179      0.122    0.147  8.83e- 1
8 CampaignChannel_SEO          -0.00262     0.122   -0.0215 9.83e- 1
  • The chi-square test for CampaignChannel is not significant (χ² ≈ 2.78, p ≈ 0.59) — channel choice alone shows no reliable association with conversion
  • The chi-square test for CampaignType is significant (χ² ≈ 84.5, p < 0.001) — campaign type is meaningfully associated with conversion, driven mainly by the "Conversion" type having a substantially higher rate (~93%) than Awareness/Consideration/Retention (~84–88%)
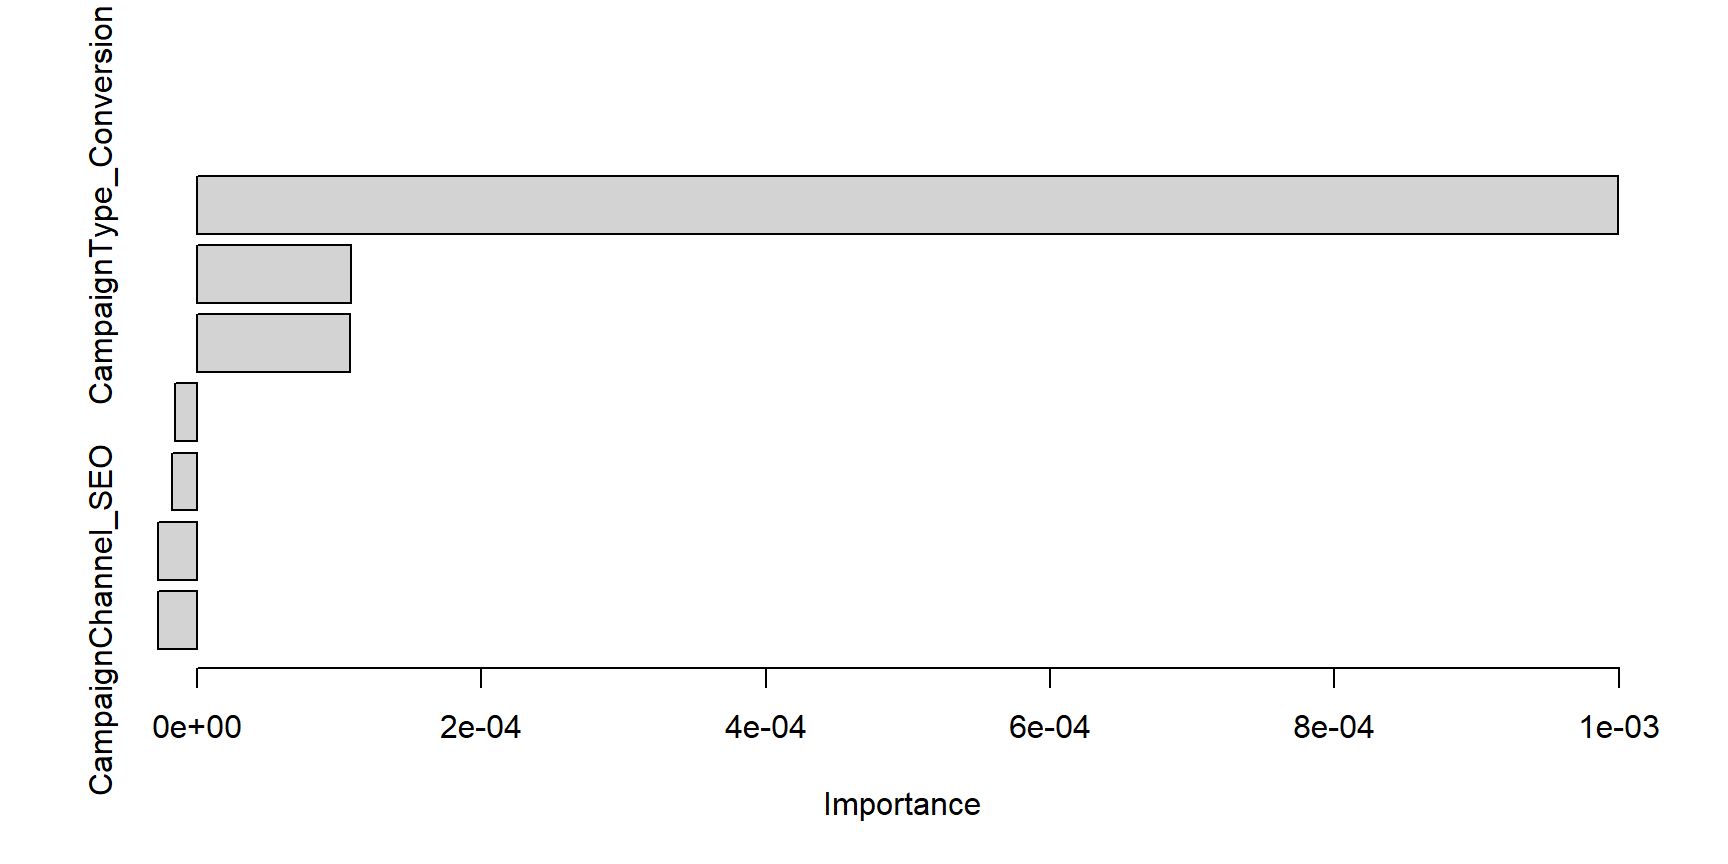
  • Random Forest variable importance should echo this: dummy variables for CampaignType should rank above CampaignChannel dummies

AO2: Summary Findings

  • Campaign type has a statistically significant relationship with conversion; campaign channel does not, at least on its own
  • The higher conversion rate for CampaignType == "Conversion" campaigns is expected by design (these campaigns are explicitly built to drive conversion) but confirms the labeling is consistent with actual outcomes
  • Despite the significant group-level association, channel + type alone give weak individual-level predictive power (ROC AUC ≈ 0.53) — they are not sufficient by themselves to identify which specific customers will convert
  • Business implication: channel selection appears interchangeable for conversion purposes in this data, so budget allocation decisions should weigh cost-per-channel and other KPIs rather than assuming any one channel converts better; campaign type mix (more bottom-funnel “Conversion”-type campaigns) is the lever more strongly tied to conversion outcomes

Analytics Objective 3 — Grace Sen

Do demographics help identify customers who convert?

Analytics Objective 3

Examine whether age, gender, and income are associated with—and useful for predicting—customer conversion.

Predictors: Age · Gender · Income
Outcome: Conversion (binary classification)

AO3: Data Wrangling & Visualization — Sample and Outcome

  • 8000 customers
  • 0 missing values in AO3 variables
  • Conversion rate: 87.6%

Accuracy alone is misleading: predicting “Converted” for everyone already produces high accuracy.

Primary metrics: ROC AUC, PR AUC, balanced accuracy, sensitivity, and specificity.

AO3: Data Wrangling & Visualization — Income and Gender

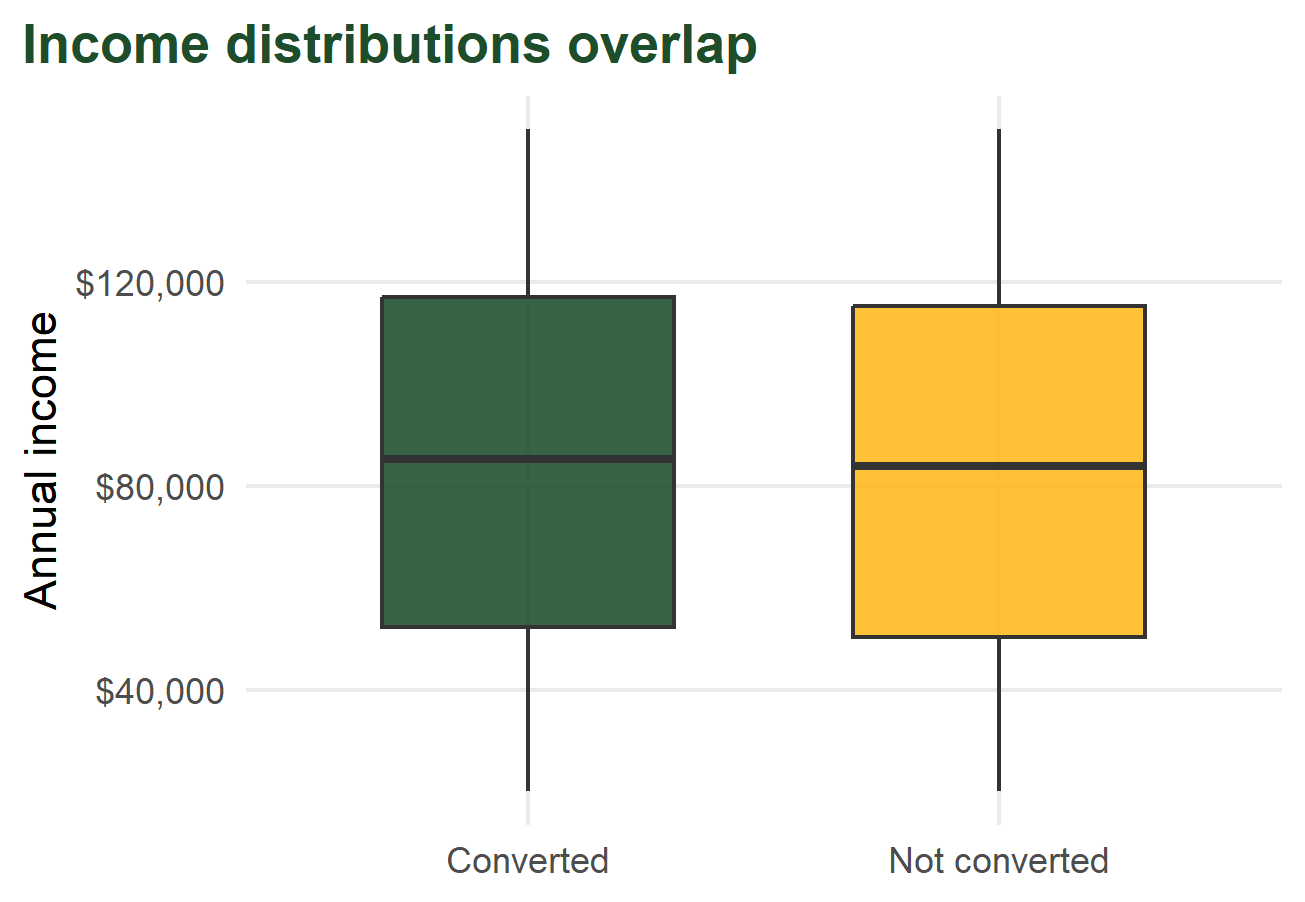
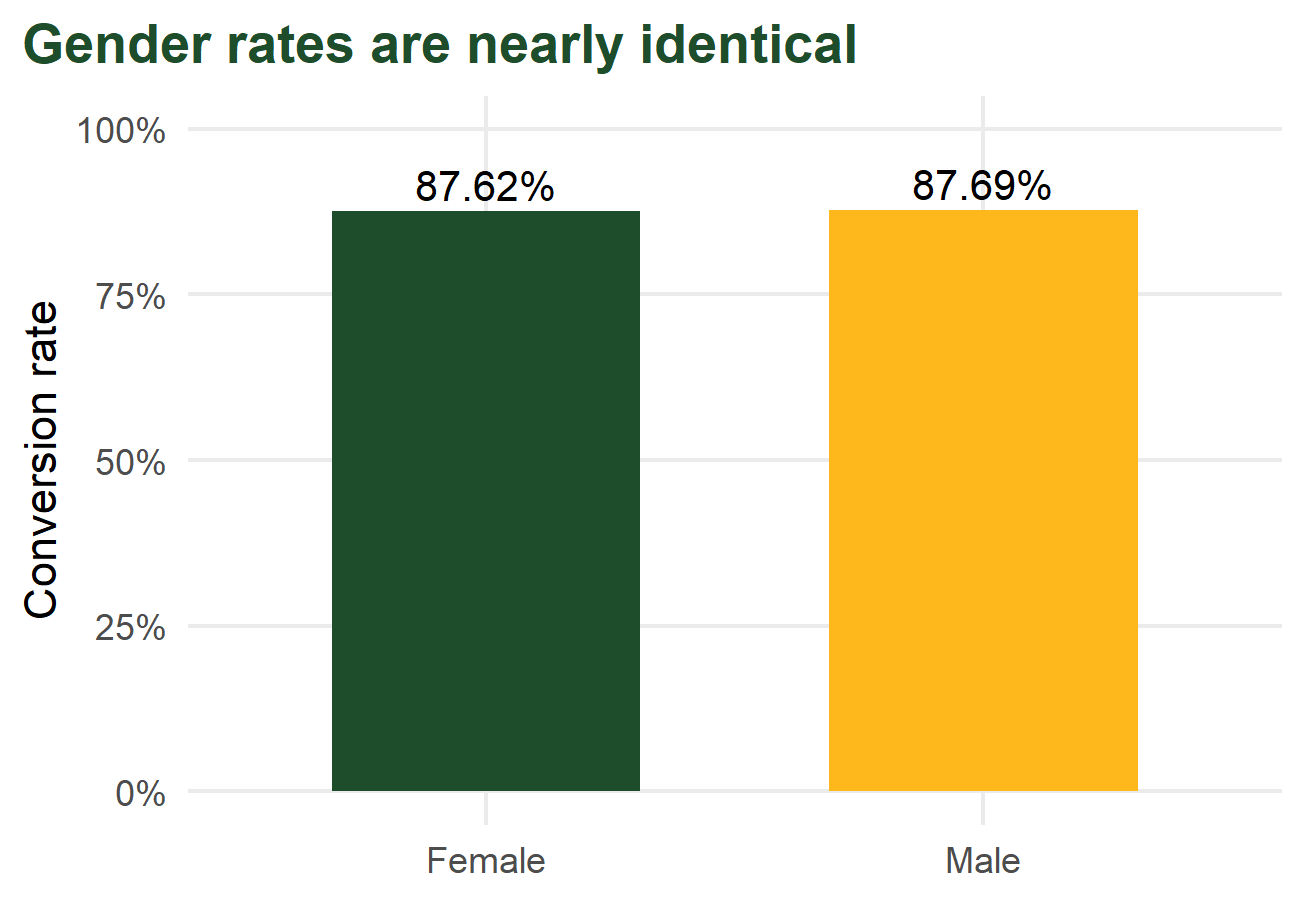
Neither income nor gender appears to distinguish converters from non-converters on its own.

AO3: Data Wrangling & Visualization — Age

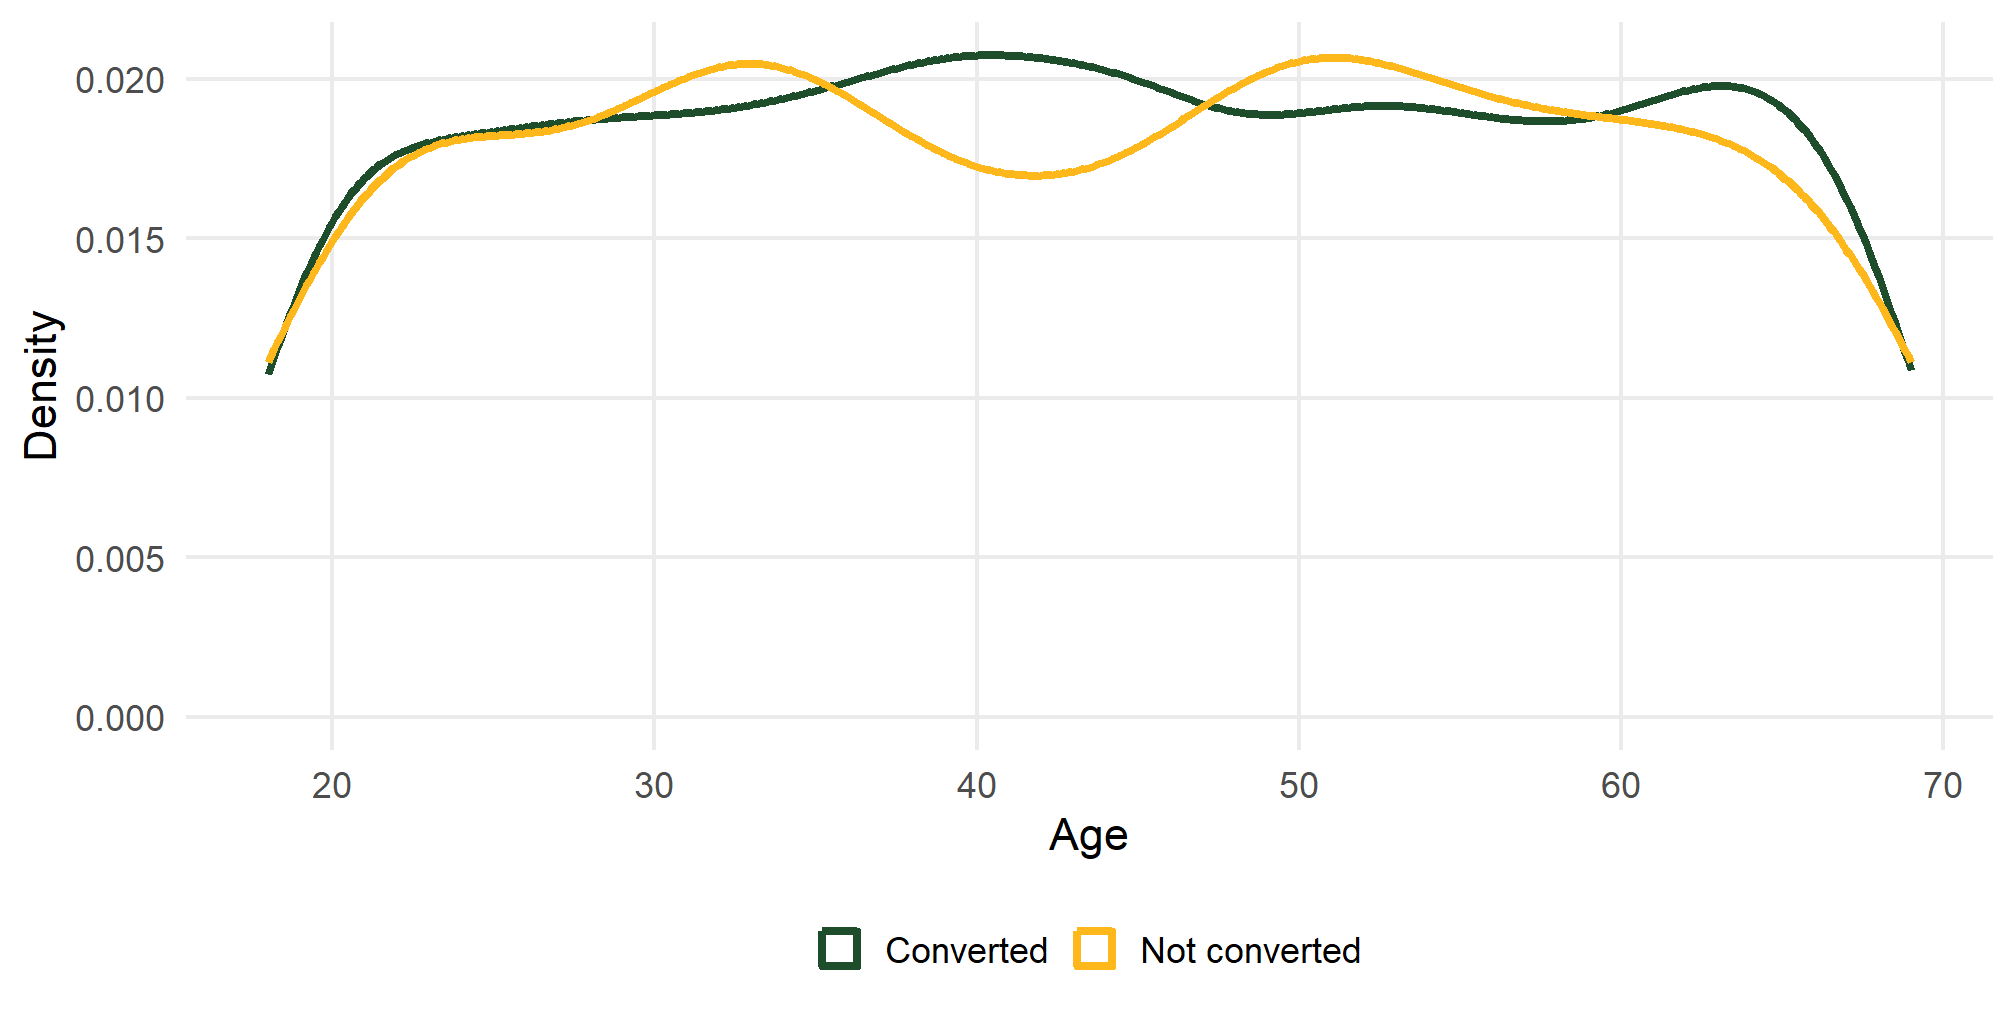
Age provides little visible univariate discrimination across nearly the entire range.

AO3: Machine Learning Methods & Model Fitting

Logistic regression

  • Interpretable adjusted associations
  • Standardized age and income
  • Odds ratios with 95% confidence intervals

Random forest

  • Captures nonlinearities and interactions
  • 500 trees
  • Five-fold stratified cross-validation
  • Tuned mtry and minimum node size

Leakage-safe evaluation

  1. Stratified 75/25 train–test split
  2. Training-only preprocessing recipe
  3. Dummy-code gender; normalize numeric predictors
  4. Tune the forest within training folds
  5. Evaluate once on the untouched test set

The majority-class prediction serves as the benchmark.

AO3: Prediction & Model Evaluation

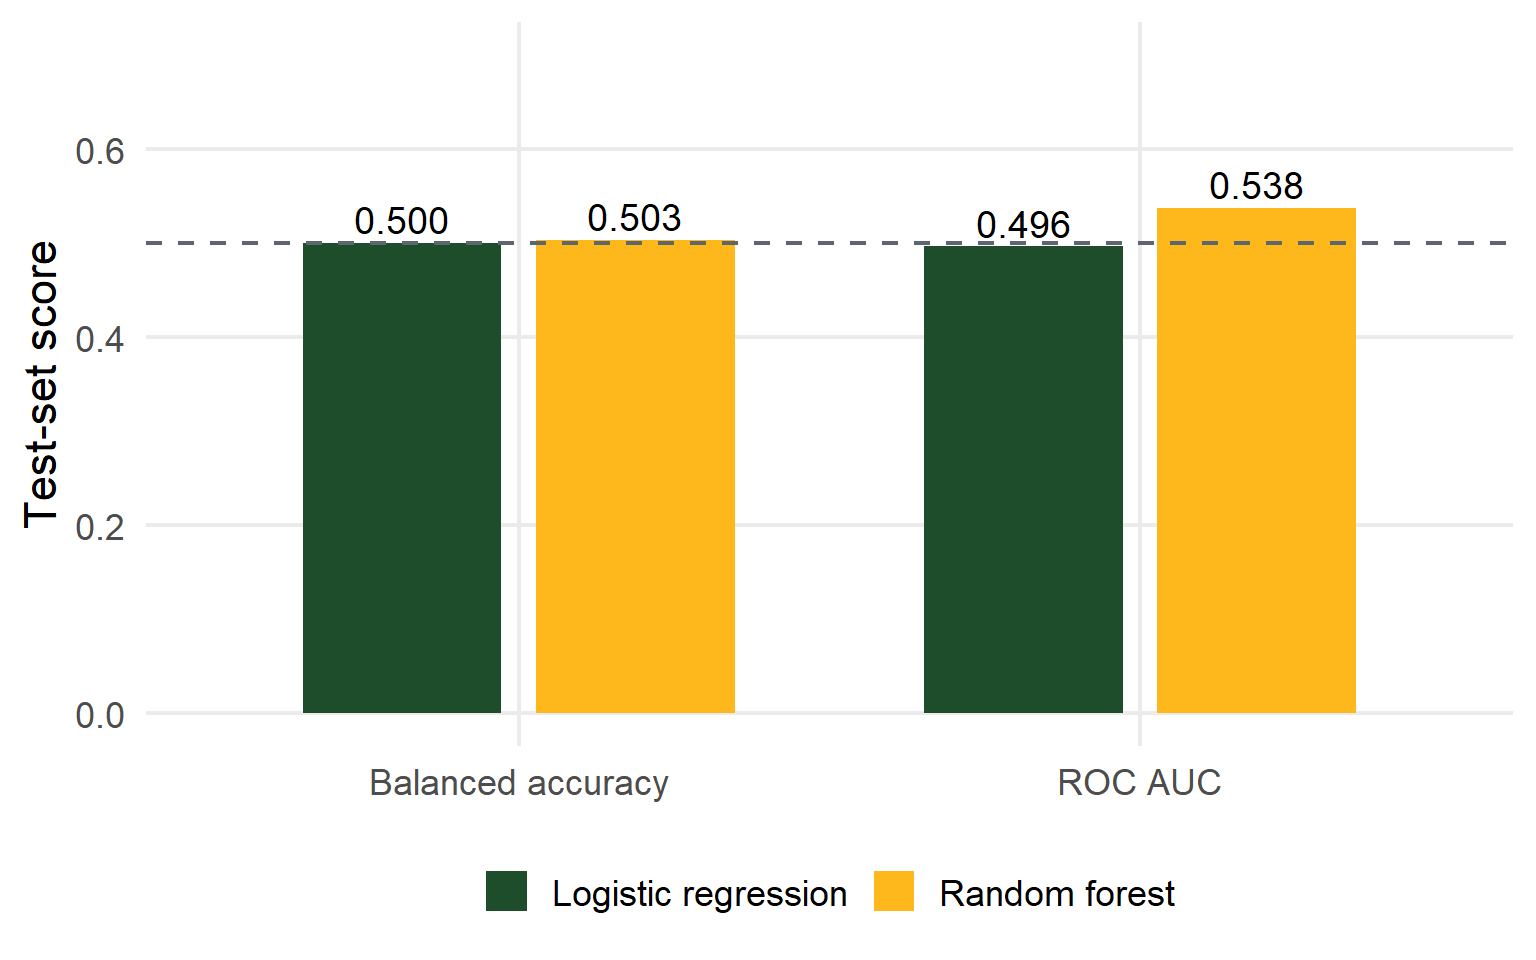
Held-out conclusion

Better-performing model: Random forest

ROC AUC: 0.538

Balanced accuracy: 0.503

Scores near 0.50 indicate little ability to rank converters above non-converters.

AO3: Interpretation — Logistic Regression

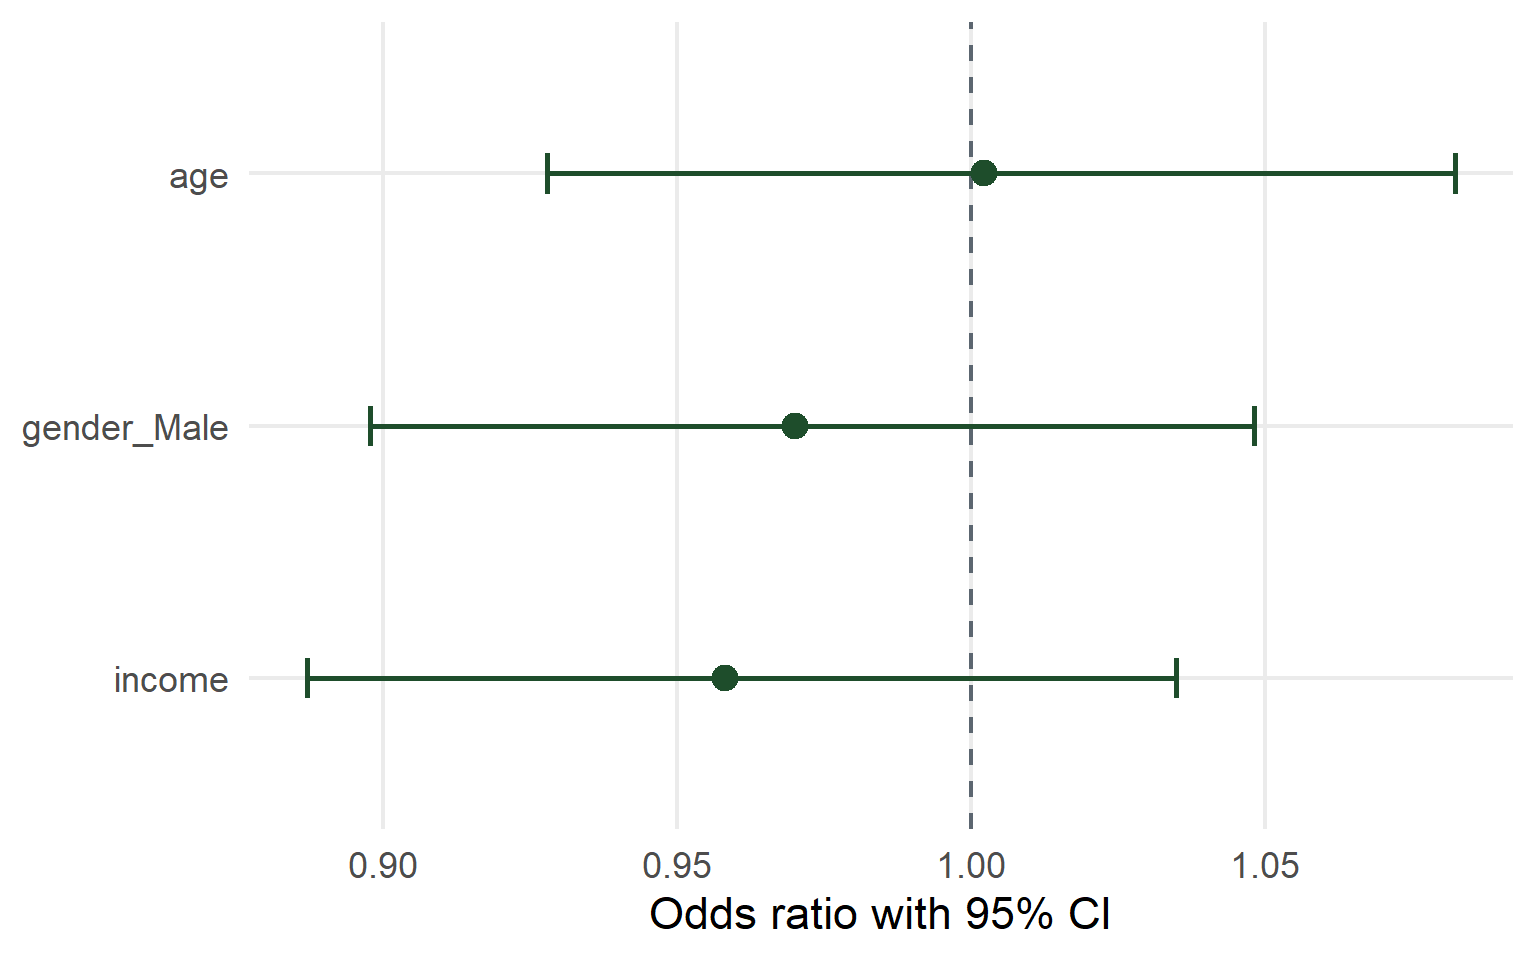
  • Odds ratios near 1.00 indicate weak adjusted associations.
  • Intervals crossing 1.00 indicate limited evidence after controlling for the other demographics.
  • Association does not imply causation.

AO3: Interpretation — Random Forest

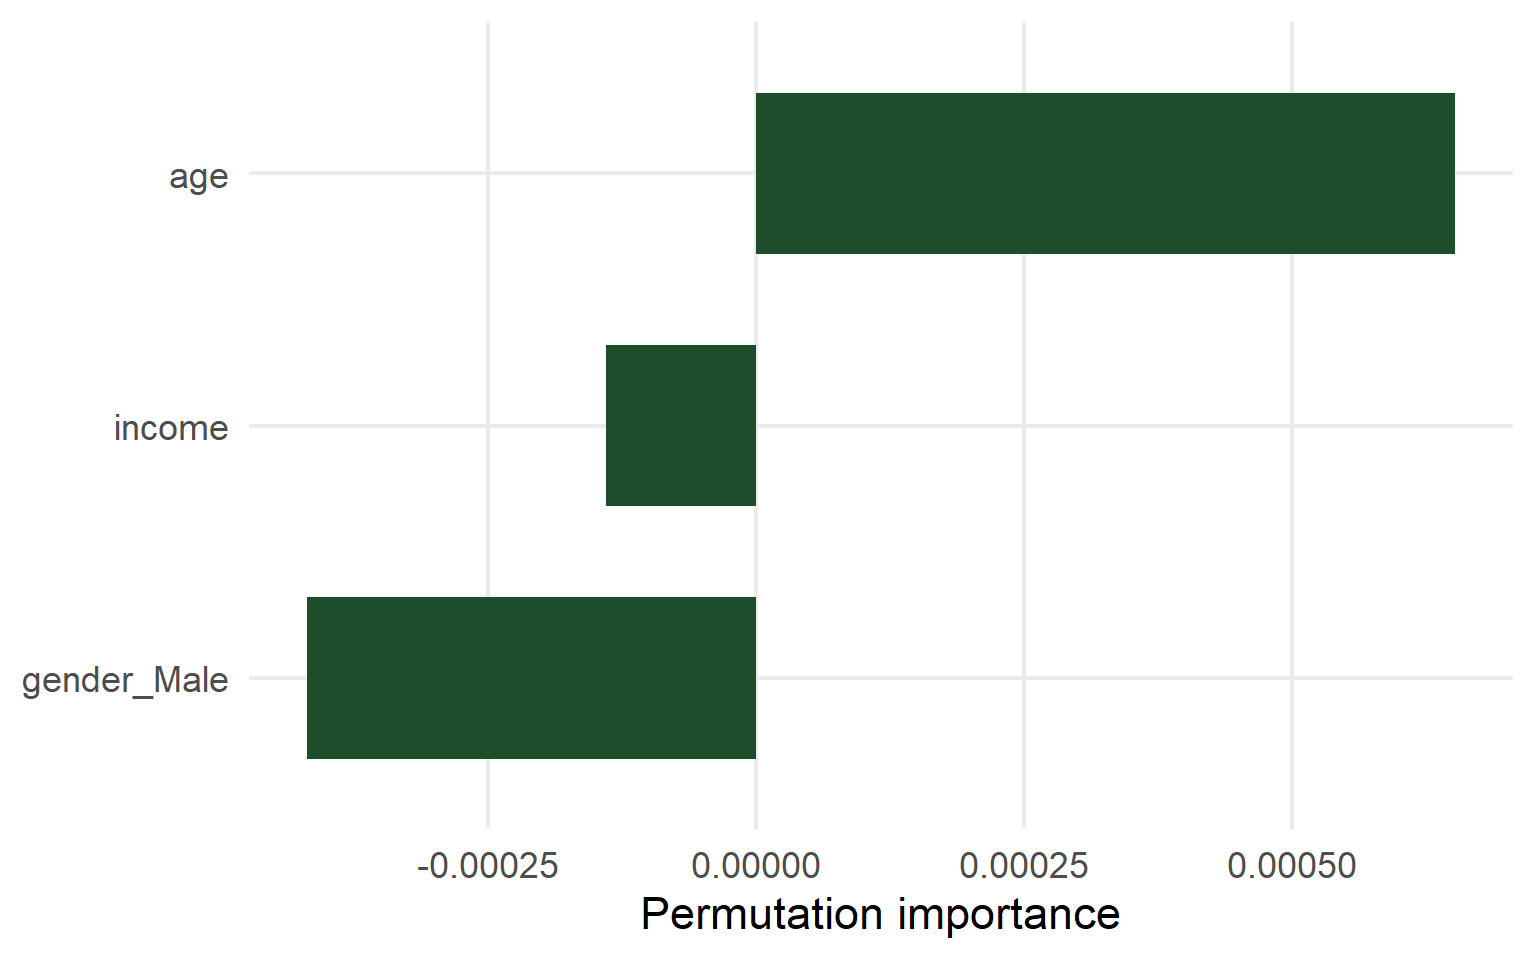
Permutation importance ranks predictors within the fitted forest.

A weak model can still rank weak predictors. Importance is relative and does not establish a business driver or causal effect.

AO3: Summary Findings

What AO3 found

  • Demographic distributions overlap substantially.
  • Both models showed weak test-set discrimination.
  • Demographics alone are insufficient for targeting.

Business implication

  • Prioritize behavioral and engagement signals.
  • Use demographics for segmentation and fairness checks.
  • Validate the final model on external data.

Takeaway: Customer behavior is more promising than demographics for predicting conversion.

Analytics Objective 4 — Sandy Zhu

AO4: Customer Interaction, Purchase Behavior, and Conversion

RO4: How do email engagement (EmailOpens and EmailClicks) and previous purchases affect customer conversion, and which factor is the most important for predicting conversion?

  • Target variables: ConversionRate, Conversion (No / Yes)
  • Independent variables: EmailOpens, EmailClicks, PreviousPurchases
  • Problem type: Regression and binary classification
  • Business question: How do email engagement and previous purchases relate to customer conversion?
  • Analytical focus: Compare models and identify which customer behavior is most important for predicting conversion.

AO4: Machine Learning Methods to be Used

Regression-Focused Method

  • Linear Regression — predicts ConversionRate as a continuous marketing outcome.

Classification-Focused Method

  • Logistic Regression — predicts whether a customer converts (Yes / No).

Ensemble Method

  • Random Forest — captures nonlinear patterns and identifies important behavioral predictors.

AO4: Data Wrangling & Visualization

  • The dataset contains 8,000 customers, with no missing values in the variables used for RO4.
  • Approximately 87.7% of customers converted, indicating substantial class imbalance in the binary outcome.
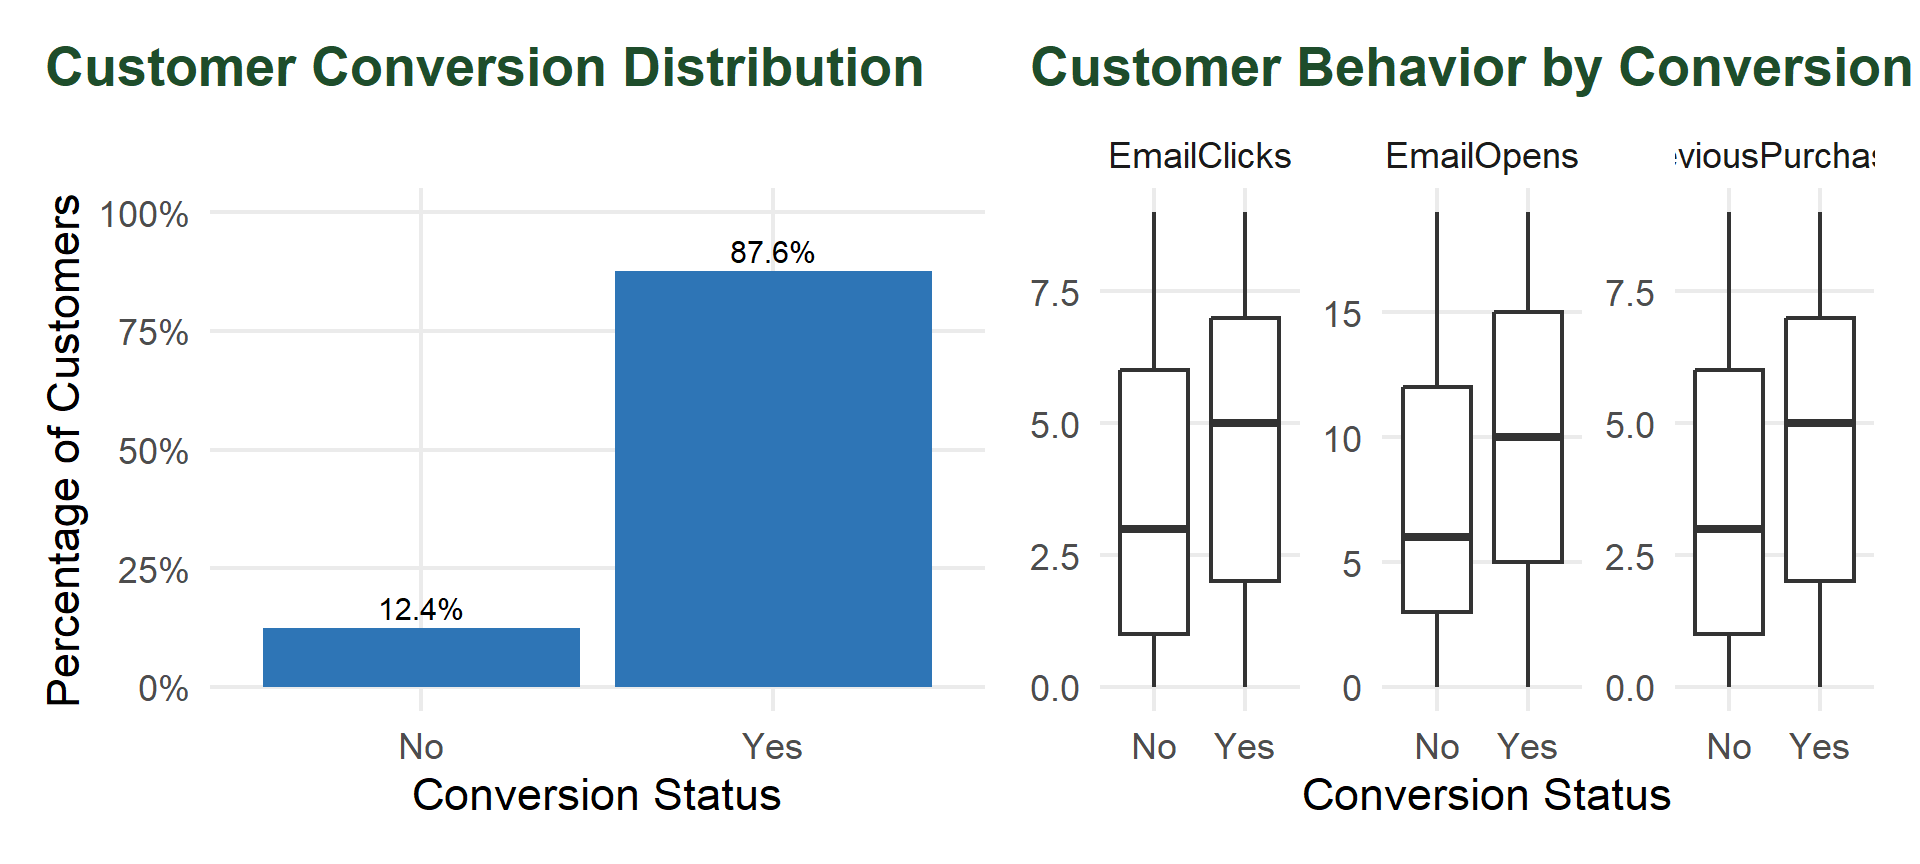
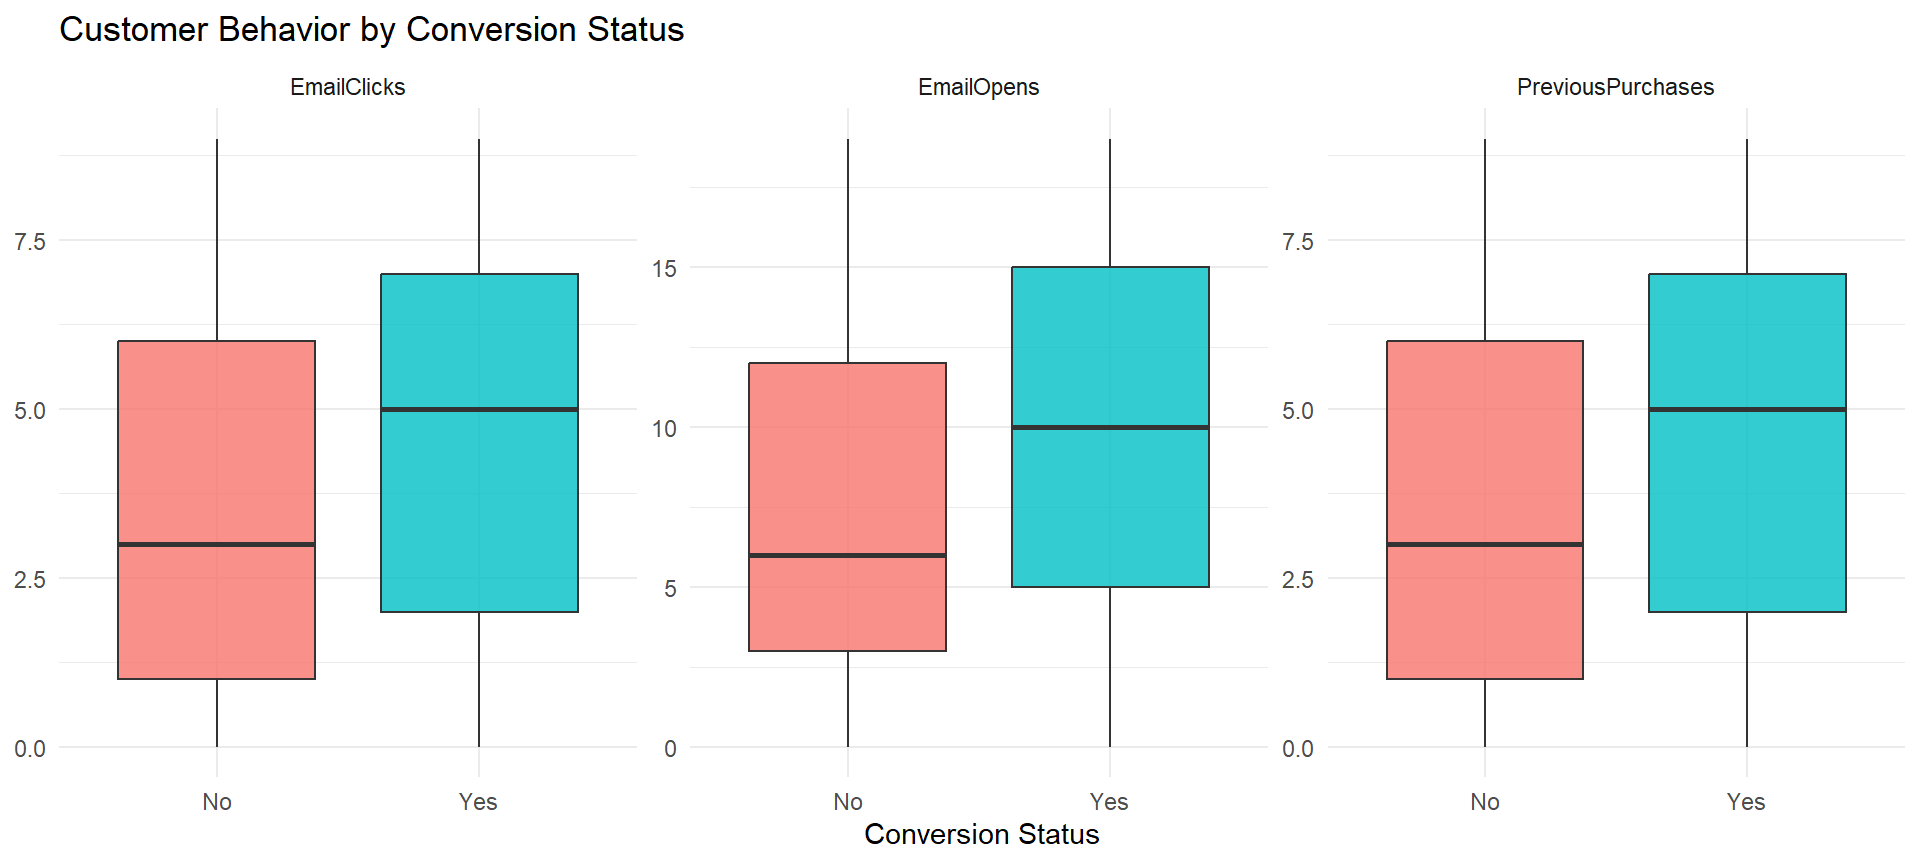
  • Customers who converted generally show higher EmailOpens, EmailClicks, and PreviousPurchases than non-converters.
  • These descriptive patterns suggest that customer interaction and prior purchasing behavior may contain useful information for predicting conversion.

AO4: Customer Behavior × Conversion Pattern

  • Converted customers show higher email engagement (median opens: 10 vs. 6; clicks: 5 vs. 3).
  • They also have more previous purchases, suggesting stronger engagement is associated with conversion.

AO4: Model Fitting

  • Split: 80% training / 20% testing, stratified by Conversion
  • Regression model: Linear Regression predicts ConversionRate
  • Classification models: Logistic Regression, Decision Tree, and Random Forest predict Conversion
  • Purpose: compare interpretable linear/classification methods with tree-based and ensemble approaches.

AO4: Prediction & Model Evaluation

# A tibble: 3 × 3
  .metric .estimator .estimate
  <chr>   <chr>          <dbl>
1 rmse    standard    0.0559  
2 rsq     standard    0.000587
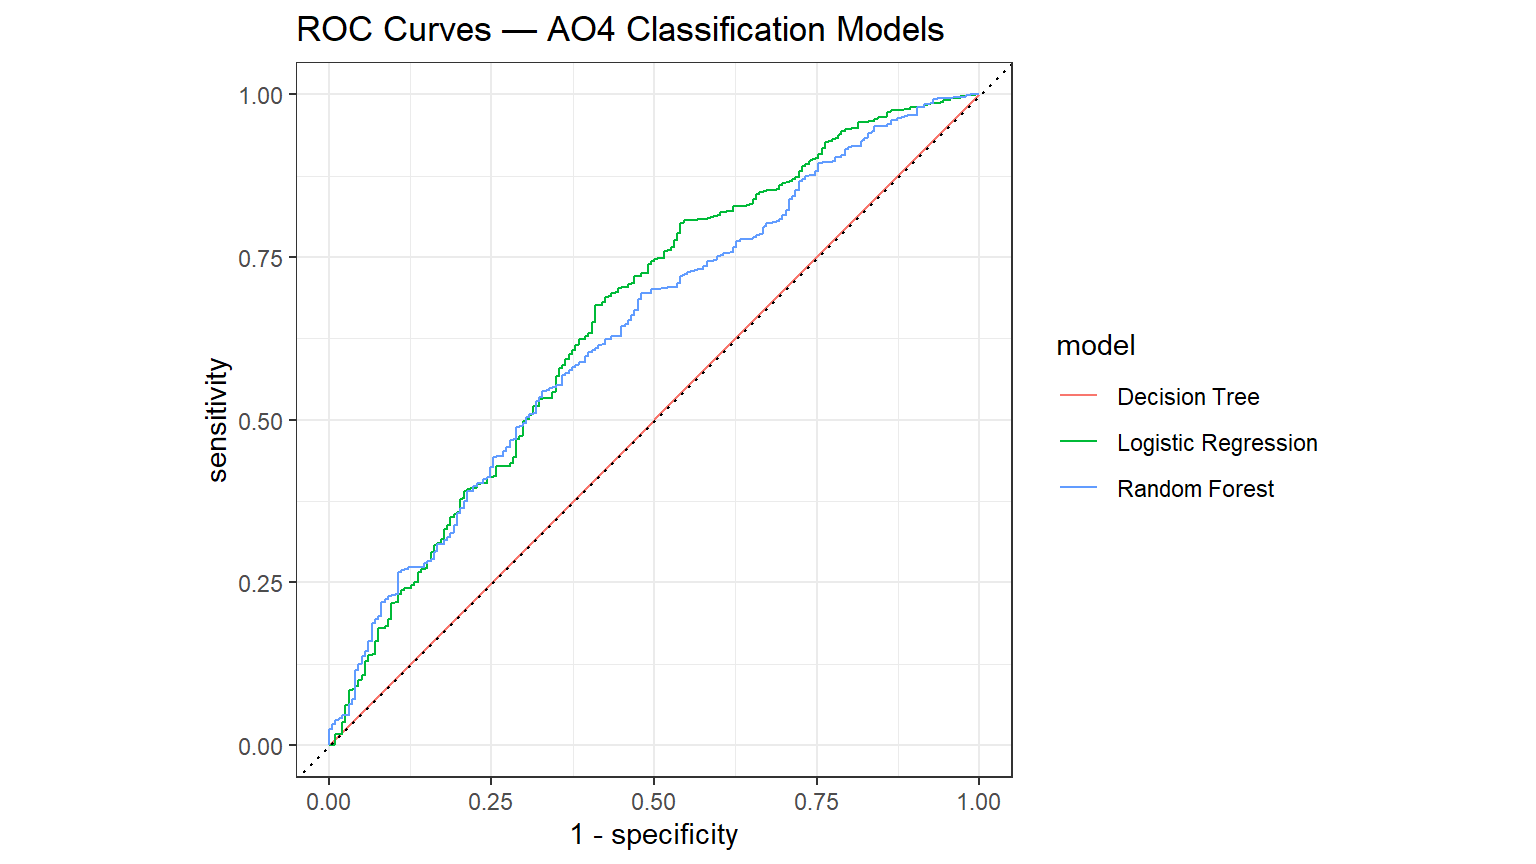
3 mae     standard    0.0490  
# A tibble: 3 × 5
  model               Accuracy ROC_AUC Sensitivity Specificity
  <chr>                  <dbl>   <dbl>       <dbl>       <dbl>
1 Decision Tree          0.876   0.5         1          0     
2 Logistic Regression    0.876   0.656       1          0     
3 Random Forest          0.869   0.637       0.979      0.0960
  • Regression: Linear Regression is evaluated using RMSE, MAE, and R² to determine how well customer behavior predicts ConversionRate.
  • Classification: Logistic Regression, Decision Tree, and Random Forest are compared using the same held-out test set.
  • Because approximately 87.7% of customers converted, accuracy alone may overstate model performance.
  • ROC AUC is the primary classification metric, because it measures how well each model distinguishes converters from non-converters across probability thresholds.

AO4: Interpretation

# A tibble: 3 × 7
  term              estimate std.error statistic  p.value conf.low conf.high
  <chr>                <dbl>     <dbl>     <dbl>    <dbl>    <dbl>     <dbl>
1 EmailClicks           1.52    0.0406     10.3  5.87e-25     1.40      1.65
2 EmailOpens            1.52    0.0405     10.3  5.80e-25     1.40      1.64
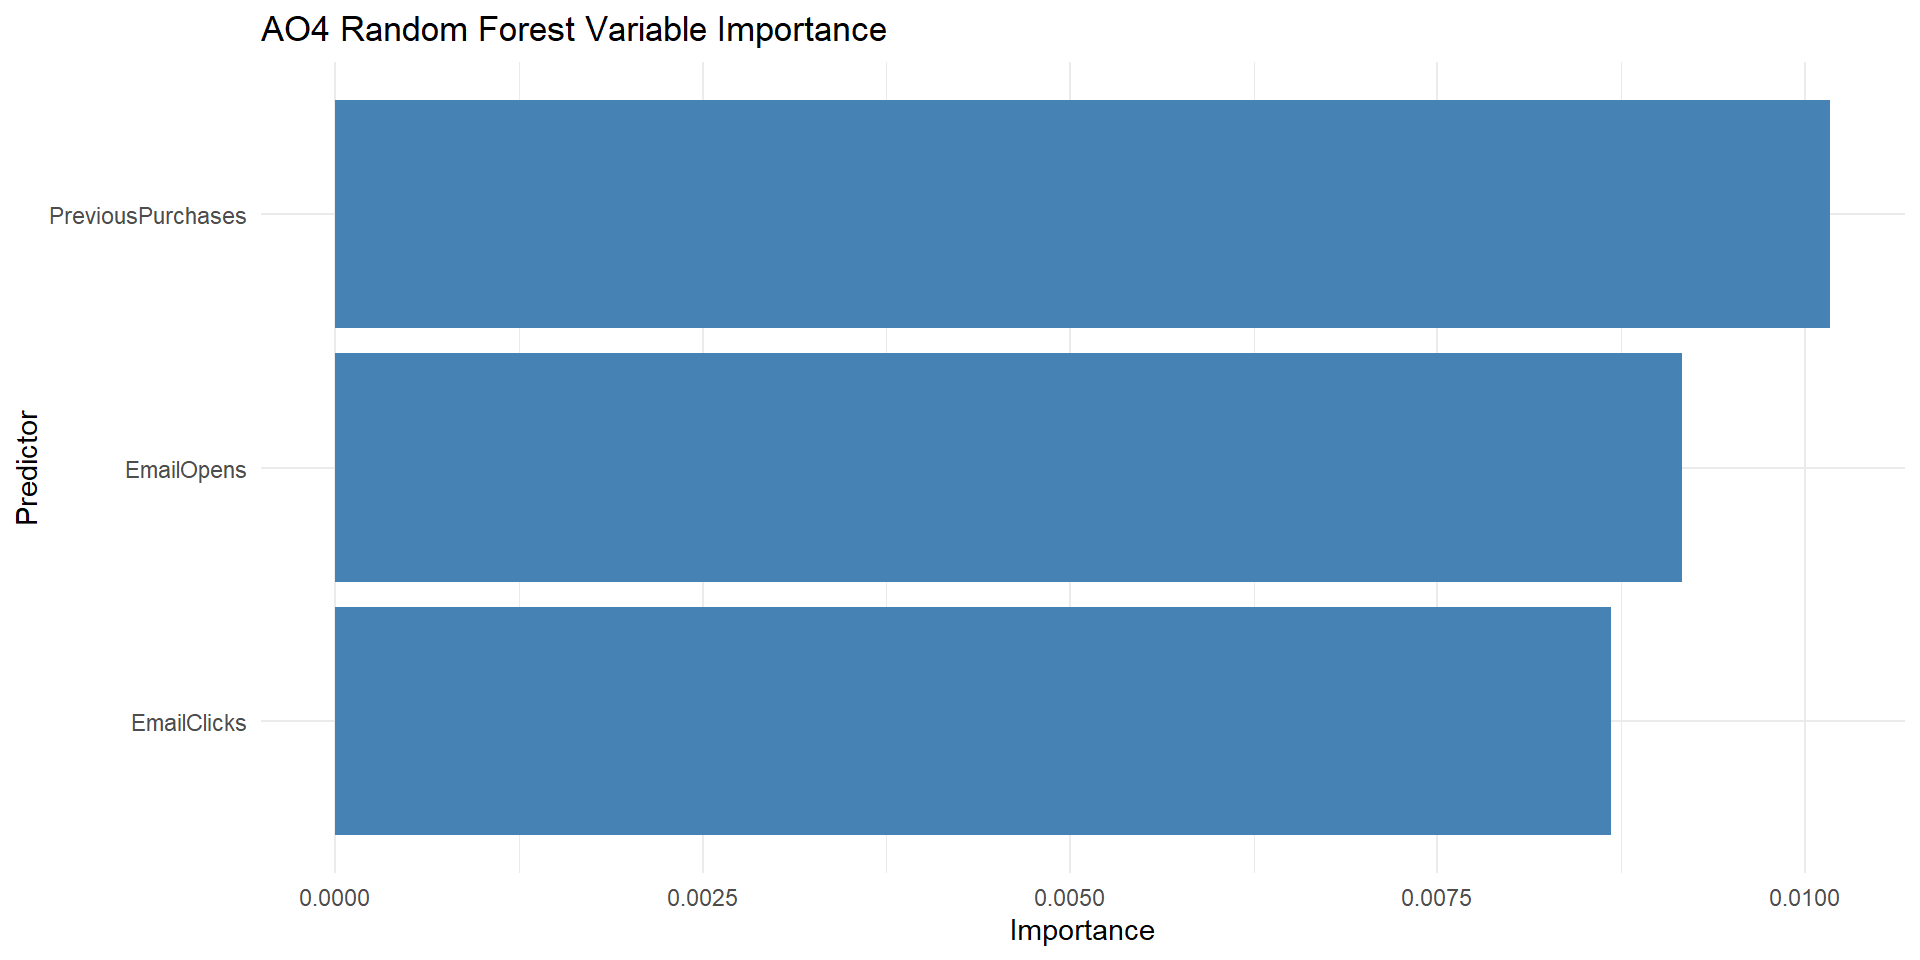
3 PreviousPurchases     1.47    0.0401      9.57 1.10e-21     1.36      1.59
  • PreviousPurchases is the strongest predictor, followed by EmailOpens and EmailClicks.
  • Purchase history appears to be more useful for predicting conversion than email engagement alone.
  • The model has moderate predictive power (ROC AUC = 0.656), so the results should be interpreted with caution.

AO4: Summary Findings

  • Higher EmailOpens, EmailClicks, and PreviousPurchases are associated with higher conversion.

  • PreviousPurchases is the strongest predictor, followed by EmailOpens and EmailClicks.

  • Model performance is moderate (ROC AUC = 0.656); the 87.6% conversion rate also means accuracy alone can be misleading.

  • Business implication: use both purchase history and email engagement to identify customers with higher conversion potential.

Analytics Objective 5 — Sora Hosoda

AO5: Predictive Analytics

Research Objective: To develop a predictive model that identifies the most useful factors for predicting customer conversion using customer demographics, campaign information, engagement variables, and purchase history.

  • Outcome: Conversion (Yes / No)
  • Predictors: 15 customer and marketing variables
  • Problem type: Binary classification
  • Analytical focus: Compare multiple classification models and identify the strongest predictors of conversion.

Which factors are most useful for predicting customer conversion when all major predictor groups are considered together?

AO5: Machine Learning Methods to be Used

  • Not used because Conversion is a binary outcome.
  • The analysis focuses on classification models.
  • Logistic Regression — interpretable baseline classification model
  • Decision Tree — captures nonlinear decision rules and interactions
  • Random Forest — combines many decision trees
  • XGBoost — sequentially builds trees to improve prediction

Four models were compared to determine whether ensemble methods improve prediction over simpler classification models.

AO5: Data Wrangling & Visualization

Predictor Group Variables
Customer Profile Age, Gender, Income
Campaign Channel, Type, Ad Spend
Engagement CTR, Website Visits, Pages per Visit, Time on Site, Email Activity, Social Shares
History Previous Purchases, Loyalty Points
Conversion Customers Share
Yes 7,012 87.6%
No 988 12.4%

Class imbalance: About 88% of customers converted.

Because the outcome is highly imbalanced, ROC AUC was prioritized over accuracy when comparing models.

AO5: Model Fitting

Data Splitting

  • 80% training / 20% testing
  • Stratified by Conversion
  • Test data held out for final evaluation

Recipe Creation

  • Median imputation
  • Novel and unknown factor handling
  • Dummy encoding
  • Zero-variance removal

Model Specification

  1. Logistic Regression
  2. Decision Tree
  3. Random Forest
  4. XGBoost

Model Selection

  • 10-fold stratified cross-validation
  • Hyperparameter tuning for ensemble models
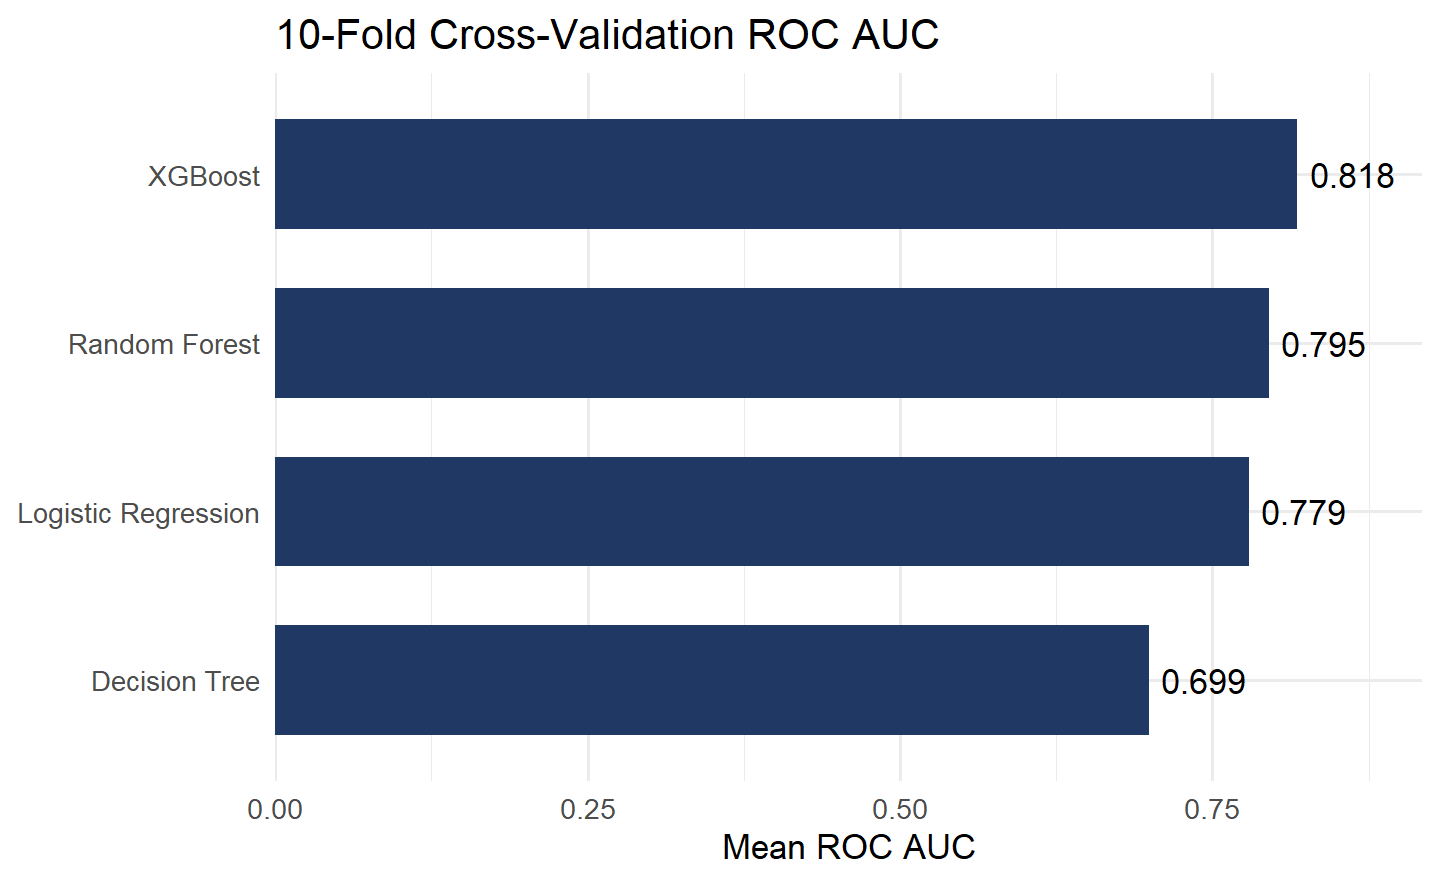
  • Primary metric: ROC AUC

The same training data and cross-validation framework were used to compare model performance.

AO5: Prediction & Model Evaluation

Best Model: XGBoost

Metric Test Result
ROC AUC 0.844
Accuracy 91.8%
Sensitivity 99.5%
Specificity 37.4%

Confusion Matrix

Actual Yes Actual No
Predicted Yes 1,396 124
Predicted No 7 74

XGBoost achieved the highest cross-validation ROC AUC and the strongest overall test performance.

AO5: Interpretation — Variable Importance & SHAP

NULL

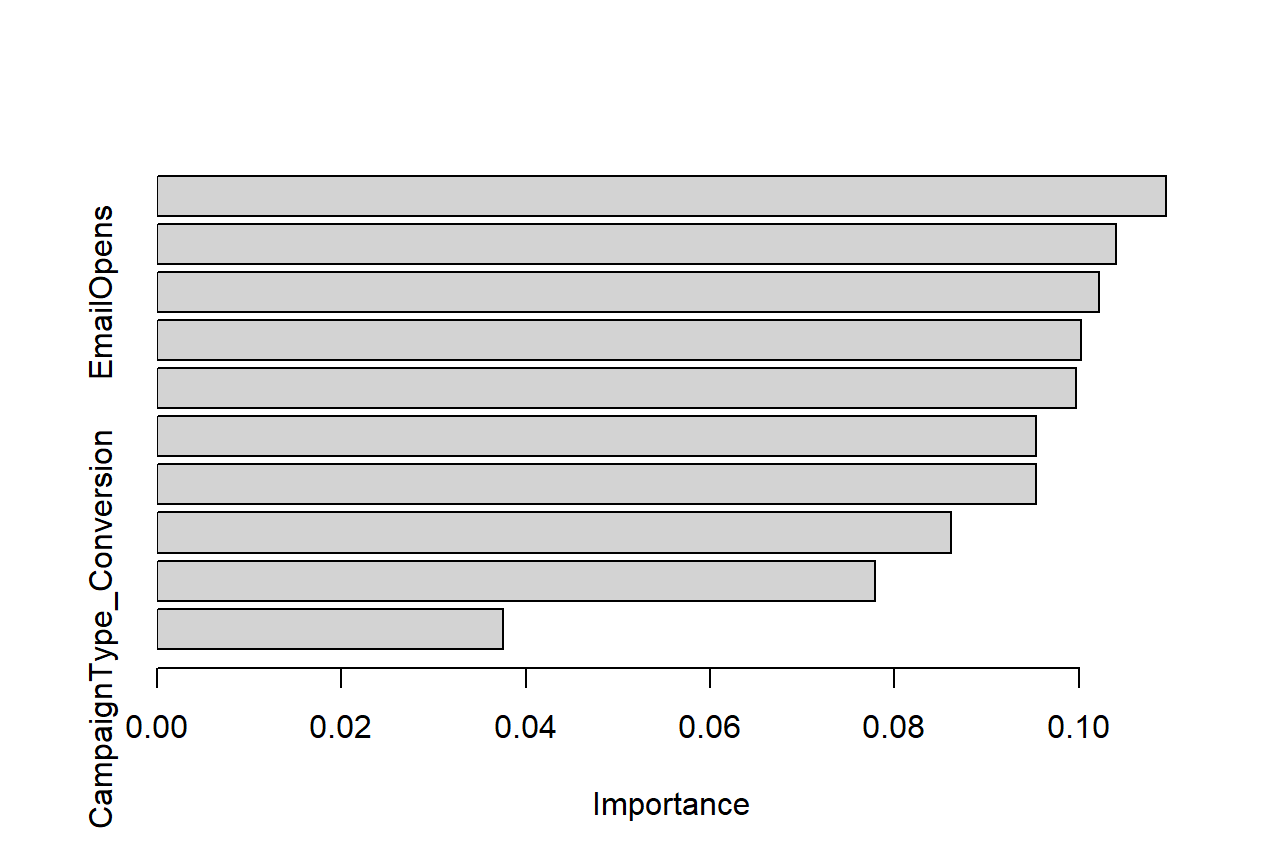
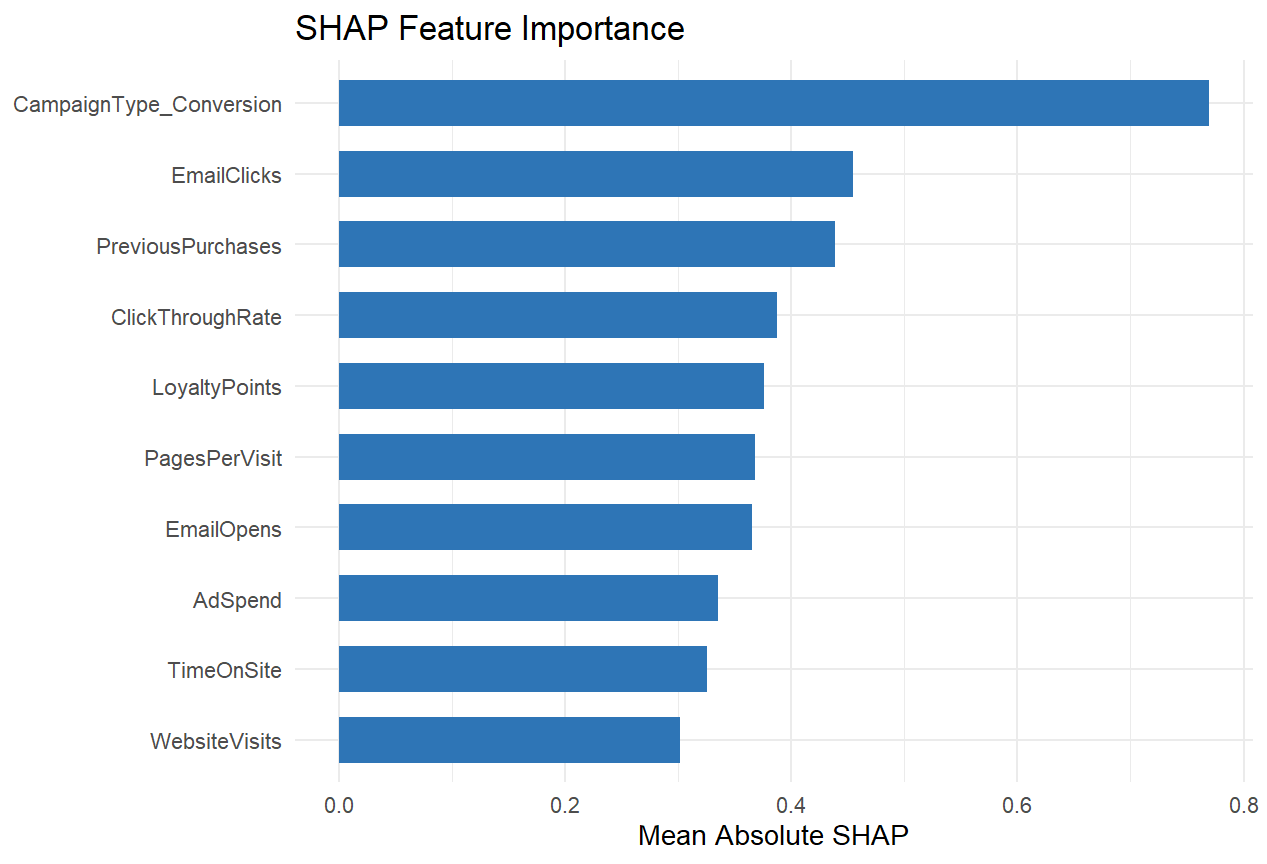
SHAP identified CampaignType_Conversion, EmailClicks, PreviousPurchases, ClickThroughRate, LoyaltyPoints, and PagesPerVisit as leading contributors to prediction.

AO5: Interpretation — Partial Dependence Plot

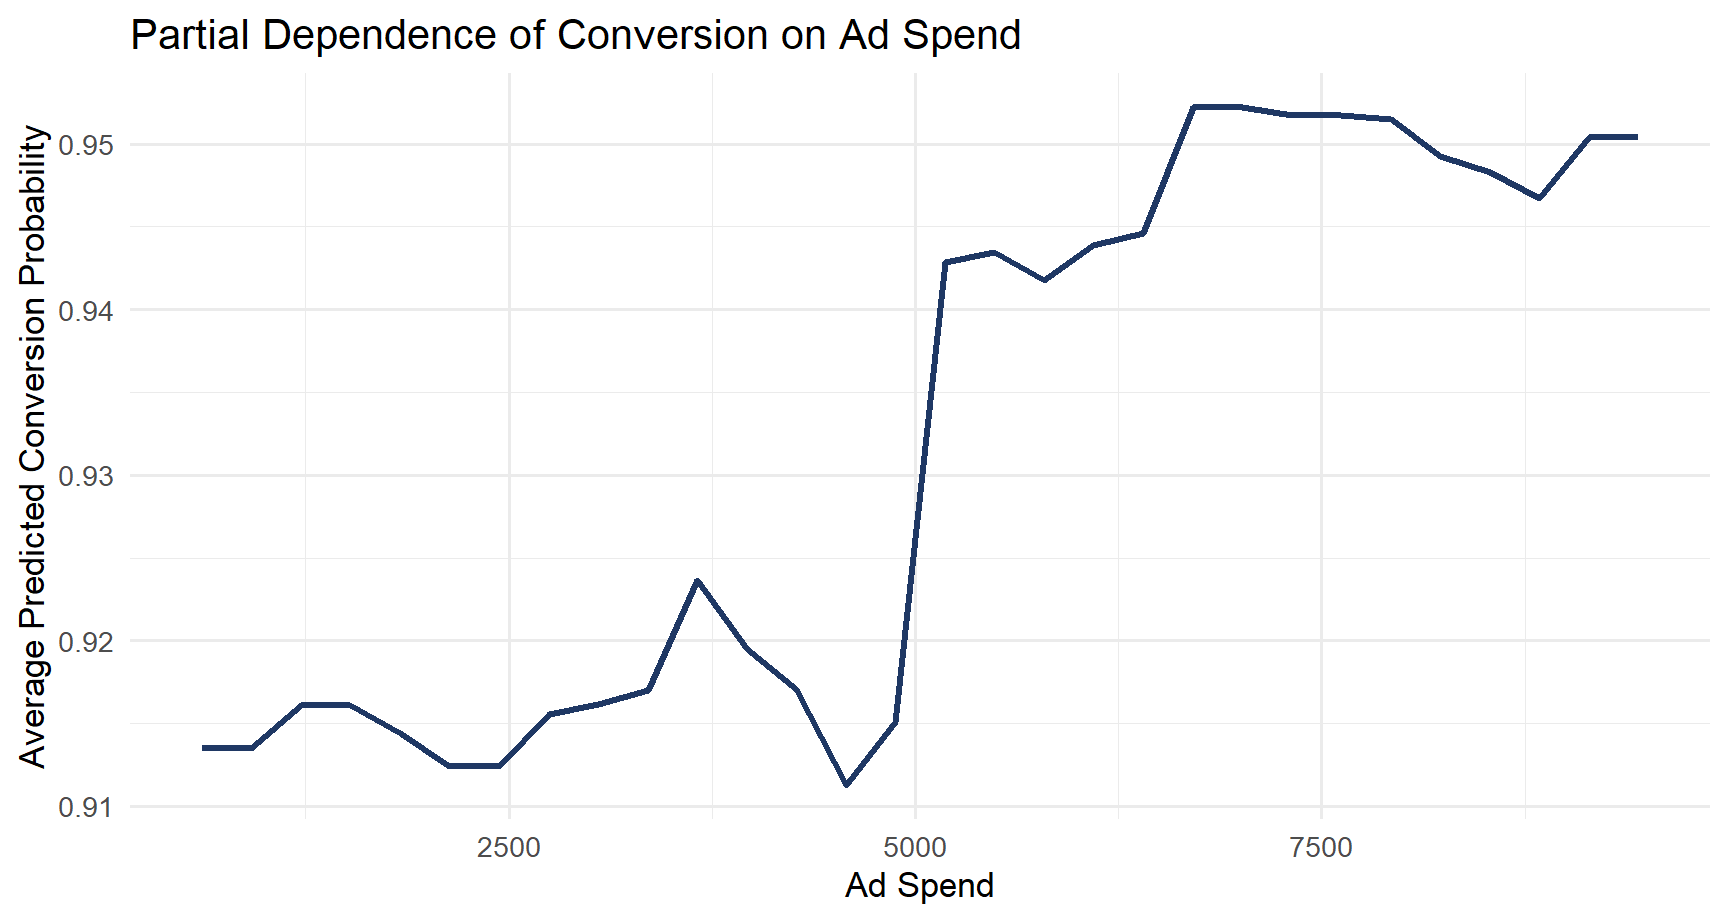
Predicted conversion remained fairly stable at lower spending levels, increased around Ad Spend ≈ 5,000, and then remained relatively high.

AO5: Summary Findings

Model Findings

  • XGBoost was the strongest model.
  • CV ROC AUC = 0.818
  • Test ROC AUC = 0.844
  • Very high sensitivity = 99.5%
  • Non-converters remained harder to identify.

Interpretation

  • Campaign type contributed strongly.
  • Email engagement was important.
  • Previous purchases and loyalty contributed.
  • Website engagement also mattered.
  • Demographics contributed less.

Customer actions, campaign context, and purchase history were more useful for predicting conversion than demographic characteristics alone.

Conclusion

Key Findings

  • Campaign type mattered more than channel: Conversion-focused campaigns had the highest conversion rates.
  • Customer behavior was useful for prediction: Engagement, previous purchases, loyalty, and website activity contributed to conversion prediction.
  • Demographics had limited predictive value: Age, gender, and income were weaker predictors.
  • XGBoost performed best: CV ROC AUC = 0.818 and test ROC AUC = 0.844.
  • Class imbalance mattered: About 88% of customers converted, so accuracy alone was not sufficient.

Recommendations for Businesses

  • Focus on customer behavior: Use engagement and purchase history to support customer targeting.
  • Consider campaign type: Conversion-focused campaigns showed stronger conversion results.
  • Do not rely on channel alone: Also consider cost, reach, and audience fit.
  • Use predictive models for targeting: XGBoost can combine multiple customer and campaign factors.
  • Evaluate models beyond accuracy: Consider ROC AUC, sensitivity, and specificity.

Limitations and Directions for Future Research

  • Conversion is not clearly defined: The dataset does not specify what customer action counts as a conversion.
  • The outcome is imbalanced: Non-converters were more difficult to identify.
  • Time and location are not provided: The dataset does not specify a campaign period or geographic region.
  • The results are not causal: The analysis identifies associations and predictive patterns.
  • The findings come from one dataset: Future research should test other datasets and customer populations.
  • Future research should clearly define conversion and explore ways to improve prediction of non-converters.

Appendix

Thank You / Q&A